Tokens and Flow Items can be very difficult to add to a chart. This is true because they don't exist on Reset, making them difficult to select. This article shows how you can use a Process Flow to allow a Statistics Collector to record a token's changing label value, and also to chart that value over time:


The model for this example is attached (graphlabeldata.fsm). It is a very simple model:

The Scheduled Source creates three tokens, each of which create a label called data. This label is created by choosing "Add Tracked Variable" for the value, which opens this dialog box:
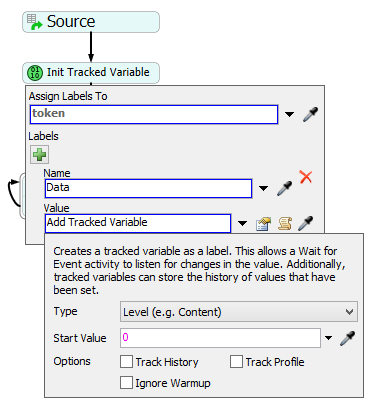
The reason we want the label to be a Tracked Variable is that Tracked Variables emit an OnChange event. We want to listen to that event. If you use the time interval collection method, discussed later in this article, you don't need to make the label a Tracked Variable.
Each token then goes through a loop, where it waits, and then updates the value. This is meant to represent a much more complicated model, where the token travels through many activities, any of which could change its label value. For this example, the model randomly changes the value on the label.
Now that we have a token and a label whose value is changing as the model runs, we can work on making a chart. We want to eventually make a Statistics Collector, but Statistics Collectors can only listen to events of objects that exist after the model has been reset. Tokens and FlowItems (along with their labels) are destroyed on reset, and so we can't listen directly to them. However, some Process Flow activities can listen to events on tokens and flowitems, and the Statistics Collector can listen to those events. For that reason, we make a second Process Flow:

This flow has an Event-Triggered Source, which listens for tokens to leave the "Init Tracked Variable" activity in the first flow. When that happens, the source creates a token, and that token immediately gets a reference to the label node (note that this is different than the value of the label node).

Next, the new token goes to a Start activity. The Start activity called "Log Change." This activity is just a placeholder. While you could technically live without this activity, it makes things a little clearer, as we will discuss later. Other than providing OnEntry and OnExit events, the Start activity has no internal logic whatsoever.
After passing through the Log Change activity, the new token waits for the label value to change:
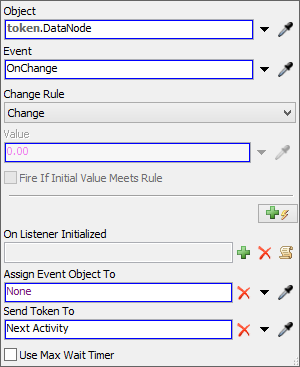
In order to listen to this event, you can first sample a Tracked Variable in the Toolbox. This provides the OnChange event. Then you can update the Object field to the code shown above.
Notice that every time this event happens, the token simply passes through the Log Change activity, and then resumes listening. When the original label value changes, it emits an OnChange event. When that event fires, the token listening to that even travels through the Log Change activity, which emits OnEntry and OnExit events. We can use these events in the Statistics Collector.
The key to this technique is that we used Process Flow, which is good at listening to token and flowitem events, to generate Activity events, which can be used in the Statistics Collector.
In the attached model, the first Statistics Collector is configured like this:

It simply listens to the On Entry of the Log Change activity. The columns are defined as follows:

The first two columns are simpler; the Time column uses the Model Date/Time option: 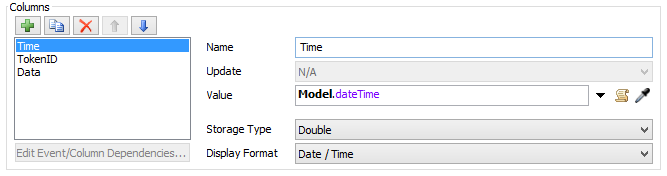
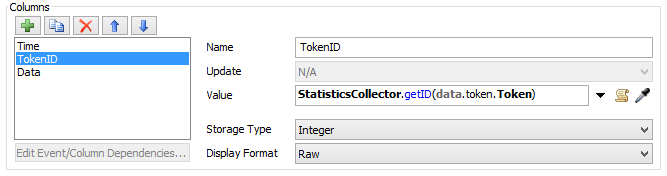
The second column gets the ID of the token as an integer:
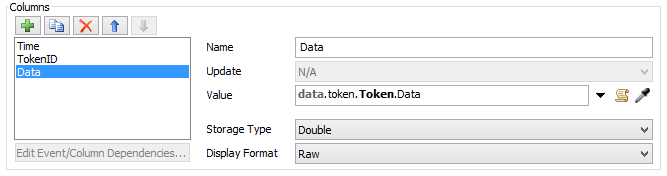
The third column gets the current value of the Data label:
Now that the Statistics Collector is set up, we can configure the chart to use this collector, and split by the Token ID.

The process to record the label value every interval (rather than on every change) is very similar. The downside is that the data is less granular, but the upside is that a label doesn't have to be a Tracked Variable to be charted. The example model simply uses a Split activity to copy the data from the Event Triggered Source, and sends it to a similar listening loop:

Instead of waiting for the value to change, the second token waits for a fixed time interval. A similar Statistics Collector will allow you to create the following chart:
This approach works for every token created by the scheduled source. No matter how many tokens you create, each will show up on the chart:

