Hello,
Is it possible with experimenter to output utilization for staff by hour summarized across days* as a box plot?
Thanks!
ed-triage-reassessment-model-9.0.fsm
*Edit: Each replication in this model's case is equivalent to one day
Hello,
Is it possible with experimenter to output utilization for staff by hour summarized across days* as a box plot?
Thanks!
ed-triage-reassessment-model-9.0.fsm
*Edit: Each replication in this model's case is equivalent to one day
After you run an experiment, you can make a Scenario Chart (in the General section of the chart library). Once you add the chart, you can point it at the box plot, and check the "current scenario" box. I ran five replications, and this is chart I got:
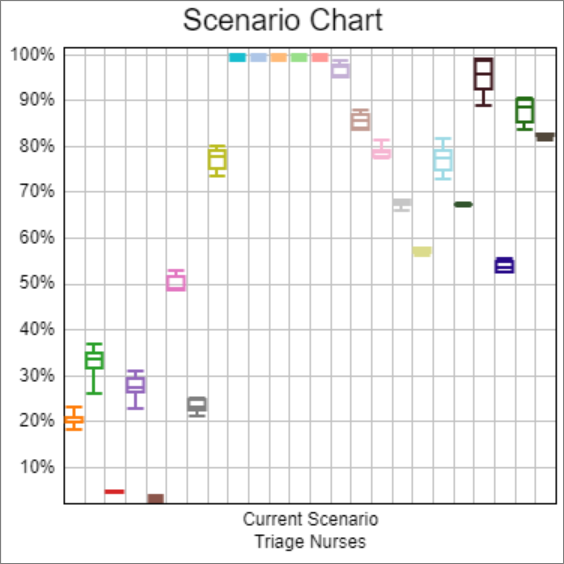
All data for all replications are categorized the same way. So in this case, I have five points for each hour, because I ran five replications. Is this what you were looking for?
14 People are following this question.
© 1993- FlexSim Software Products, Inc. All Rights Reserved.
FlexSim is a fully 3D simulation software environment. FlexSim can be used to simulate any process in any industry.
FlexSim®, FlexSim Healthcare™, Problem Solved.®, the FlexSim logo, the FlexSim X-mark, and the FlexSim Healthcare logo with stylized Caduceus mark are trademarks of FlexSim Software Products, Inc. All rights reserved.
