question

Riccardo P3 avatar image
0 Likes"
Riccardo P3 asked Riccardo P3 commented

AGV time statistic (idle, blocked, travelling load or empty)

Hi Everybody

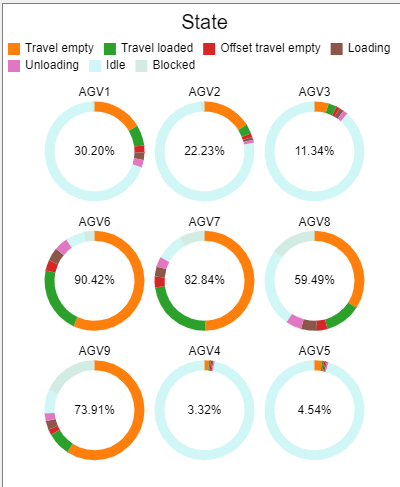
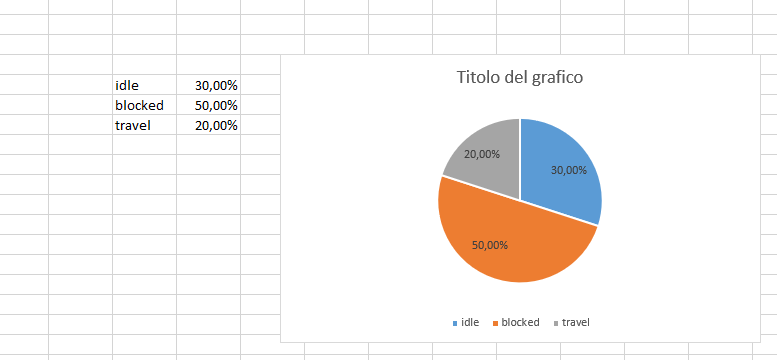
after some issues in the development of this statistic info I decided to ask to the community for some help. I was trying to realize a pie chart that represent the different percentage of the status of the AGV for both the two fleets in my model in real time.

I try some different Statistic collector, but I wasn't able to tackle this problem.

I'm pretty new with Flexsim, and I'm not always working with it, but I'm available to answer some clarification if someone want to give me a hand

Thank you all


Stastic idea.png

AGVThesisi_rev27.fsm

FlexSim 21.1.1
agvflexsim 21.1.1
stastic-idea.png (15.1 KiB)
agvthesisi-rev27.fsm (582.6 KiB)
5 |100000

Up to 12 attachments (including images) can be used with a maximum of 23.8 MiB each and 47.7 MiB total.

1 Answer

·
Fiorenzo A avatar image
0 Likes"
Fiorenzo A answered Riccardo P3 commented

Hi Riccardo,

Why don't you use default state pie chart of Flexsim?

- Open a new dashboard;

- Double click on empty space of dashboard and select the state pie chart;

- In its options select all AGV components that you have in the model;

- Reset run.


You must have this kind of pie chart:

1630338454224.png


Isn't this the result you wanted?


1630338454224.png (36.1 KiB)
· 1
5 |100000

Up to 12 attachments (including images) can be used with a maximum of 23.8 MiB each and 47.7 MiB total.

Riccardo P3 avatar image Riccardo P3 commented ·

Thank you very much Fiorenzo, this is the result that I image for the model.

I don't know because I didn't think about it

1 Like 1 ·

Write an Answer

Hint: Notify or tag a user in this post by typing @username.

Up to 12 attachments (including images) can be used with a maximum of 23.8 MiB each and 47.7 MiB total.