question

Ryosuke S avatar image
0 Likes"
Ryosuke S asked Ryan Clark commented

Is there a way of calculating average cycletime per hour?

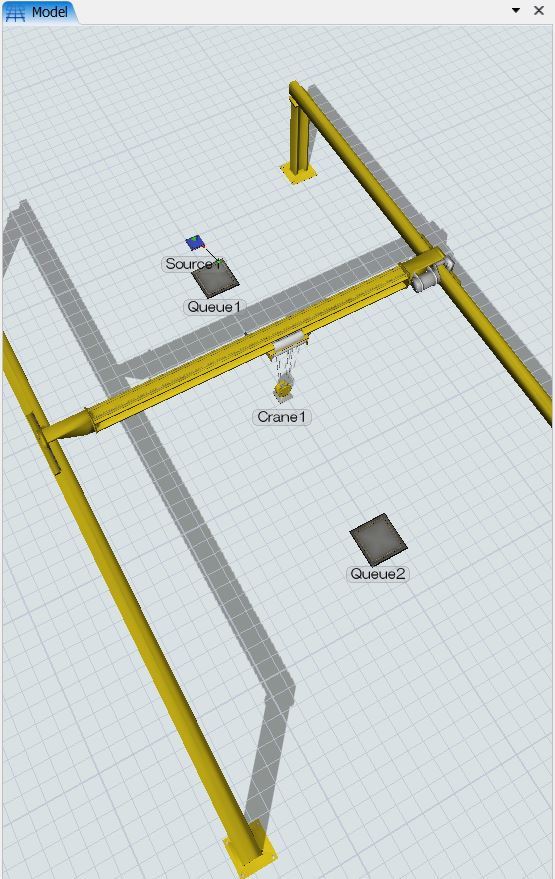
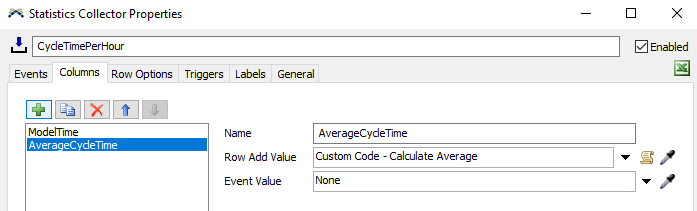
Is there a way of calculating average cycletime of a crane per hour? One cycle is from loading item at queue1, unload at queue2 then back to queue1. I first try to use the staytime, but that is not correct. I would like to show the result in graph in dashboard if possible.

capture001.jpg

Gantry_CycleTime.fsm

FlexSim 21.0.8
dashboardscranecycle time
capture001.jpg (91.9 KiB)
5 |100000

Up to 12 attachments (including images) can be used with a maximum of 23.8 MiB each and 47.7 MiB total.

1 Answer

·
Ryan Clark avatar image
0 Likes"
Ryan Clark answered Ryan Clark commented

Hello @Ryosuke S,

I'm not sure about the average cycletime per hour, but you can fairly easily track the average cycletime. In the modified version of your model attached to this post, I made a new dashboard that shows a couple options for doing what you want using the zone staytime you had created in the Object process flow. I altered the wait for event activities to trigger only when the crane loads from Queue1, so that should measure the average cycle time as you've defined it.

I hope this helps! Let us know if you have further questions!

gantry-cycletime-rc.fsm


· 3
5 |100000

Up to 12 attachments (including images) can be used with a maximum of 23.8 MiB each and 47.7 MiB total.

Felix Möhlmann avatar image Felix Möhlmann commented ·

I expanded Ryans model to include a Statistics Collector that measures the average cycle time hourly. I added an array label to the crane. The cycle times measured by the process flow are getting added to the array (Custom Code activity).

The Statistics Collector "CycleTimePerHour" is based on a timer event that fires every hour. It then notes the current model time (in dateTime format) and calculates the average cycle time from the values currently in the array label. Then it deletes those values from the array so new ones can be added in the next hour.

The code for this can be found in the "Columns" tab of the statistics collector in the "Row Add Value" field of the "AverageCycleTime" column.

1632389180161.png

I also added a line chart in Dashboard2 that displays this data.

gantry-cycletime-rc-fm.fsm

0 Likes 0 ·
Ryosuke S avatar image Ryosuke S Felix Möhlmann commented ·

@Ryan Clark @Felix Möhlmann Thank you both for helping me. Both answers were very valuable, and it was exactly what I needed! Once again thank you!

1 Like 1 ·
Ryan Clark avatar image Ryan Clark Ryosuke S commented ·
Great! Glad to help!
0 Likes 0 ·

Write an Answer

Hint: Notify or tag a user in this post by typing @username.

Up to 12 attachments (including images) can be used with a maximum of 23.8 MiB each and 47.7 MiB total.