question

chiang avatar image
1 Like"
chiang asked Jeanette F commented

Dashboard of flexsim medical edition

0905.fsm

@Felix Möhlmann

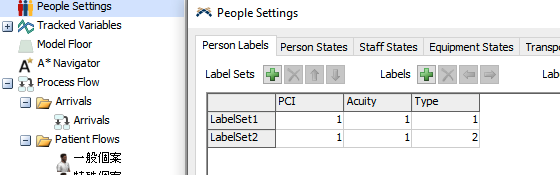
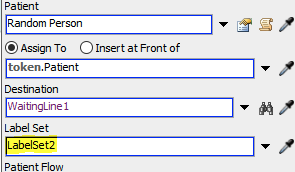
I now have two types of patients to collect, so I want the patient part of the dashboard to be able to display the production numbers of the two types of patients and I want to know how many patients have been served (need Statistics separately)

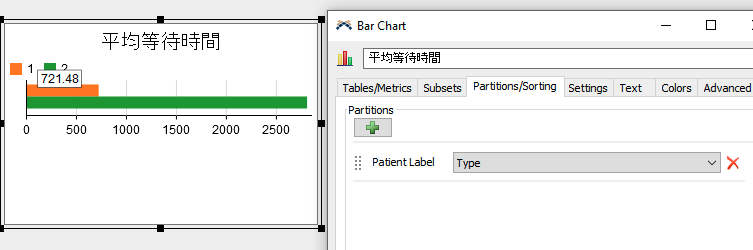
How does the dashboard know the total number of people served?

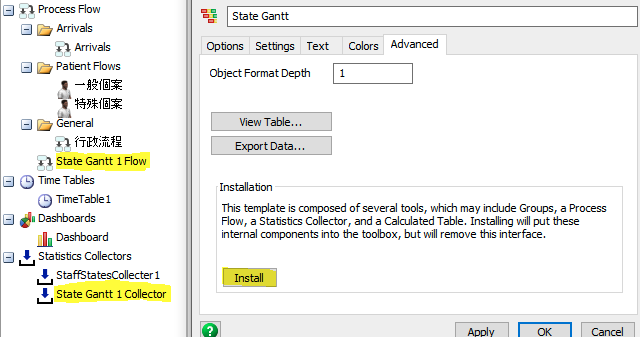
Gantt chart of workers and the proportion of time workers work

FlexSim 20.0.10
dashboardshealthcare
0905.fsm (171.4 KiB)
· 3
5 |100000

Up to 12 attachments (including images) can be used with a maximum of 23.8 MiB each and 47.7 MiB total.

Jason Lightfoot avatar image Jason Lightfoot ♦ commented ·
Please try re-uploading your model.
0 Likes 0 ·
chiang avatar image chiang Jason Lightfoot ♦ commented ·
Okok!
0 Likes 0 ·
Jeanette F avatar image Jeanette F ♦♦ commented ·

Hi @chiang, was Felix Möhlmann's answer helpful? If so, please click the "Accept" button at the bottom of their answer. Or if you still have questions, add a comment and we'll continue the conversation.

If we haven't heard back from you within 3 business days we'll auto-accept an answer, but you can always comment back to reopen your question.

0 Likes 0 ·

1 Answer

·
Felix Möhlmann avatar image
0 Likes"
Felix Möhlmann answered Felix Möhlmann commented

To be able to differentiate between the patients, add a label to the patient label set that you will use to identity them. In the screenshot below I also added a second label set with the "Type" label already set to 2, which means I can assign the different label sets directly when the patients are created.

1694189513262.png

1694189541683.png

You should then be able to partition the dashboard charts by this label value.

1694189588763.png


To get the State Gantt chart to work do the following.

- Exit the HC environment and return to the default FlexSim environment.
- Add a new state gantt chart and add the two clerks to it.
- Install the charts components. This will add a Process Flow and a Statistics Collector to the model.

1694189741523.png- Go back to the healthcare environment.
- Open the properties of the chart and assign the Statistics Collector as the data source and configure the rest of the options as below.

1694189804920.png- 
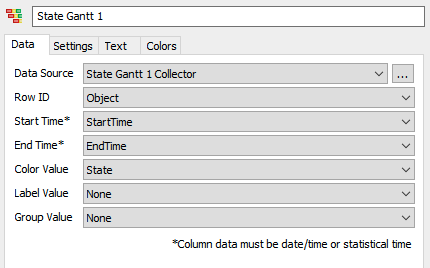
Open the State Gantt Process Flow and change the "Profile" variable to 2, to read the HC states instead of the default states.
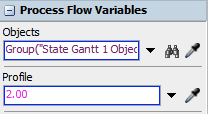
1694189853164.png

0905-fm.fsm


1694189513262.png (22.6 KiB)
1694189541683.png (11.4 KiB)
1694189588763.png (16.8 KiB)
1694189741523.png (38.8 KiB)
1694189804920.png (14.4 KiB)
1694189853164.png (5.7 KiB)
0905-fm.fsm (262.9 KiB)
· 6
5 |100000

Up to 12 attachments (including images) can be used with a maximum of 23.8 MiB each and 47.7 MiB total.

chiang avatar image chiang commented ·

0905-fm.fsmWhat I want to know now is that I want to know how many people I serve in a day (by category) and my model should not be idle (or the proportion is very small), but why are there so many results? idle

0 Likes 0 ·
0905-fm.fsm (200.2 KiB)
Felix Möhlmann avatar image Felix Möhlmann commented ·

I attached a model that contains a customized Model Throughput calculated table, that partitions the throughput by type and day.

0905_throughput.fsm

Your model eventually enters a deadlock state when a patient that has acquired one of the clerks can't acquire the "TableAndChairs" location at time 110637.


Maybe go through and check if all resources are set up correctly. A lot of them only point to "Any member of locations", which might not be correct (?)

0 Likes 0 ·
0905-throughput.fsm (174.4 KiB)
1694247443543.png (16.7 KiB)
chiang avatar image chiang Felix Möhlmann commented ·

0905-fm.fsmI don’t quite understand what you mean. Maybe it’s because they have occupied all the locations? And the new files don’t have Gantt charts or anything like that!!

0 Likes 0 ·
0905-fm.fsm (230.6 KiB)
Felix Möhlmann avatar image Felix Möhlmann chiang commented ·

A deadlock occurs, when two patients have acquired a resource/location each that the other one needs before they can release their current resource/location. This an occur if a resource/location is used at multiple points in the process. For example: The patient first goes to location A, then B and then back to A. If one patient has acquired A for the first step is now waiting for B to be free while another patient has acquired B is waiting for A to be available, they block each other from advancing.

In your model, a lot of the location resources in the Process Flow are set to use any location in the model, which can lead to the problem described above. For instance, at 110637s, when the deadlock occurs, a patient has acquired two spots at the TableAndChairs1 location for different purposes! That's why I said you should maybe check if all location resources are actually assigned correctly.

I built the throughput chart on my home PC and I didn't download the previous file first, hence it doesn't contain the working gantt chart. With the explanation and example file you should be able to integrate either of the two charts into the other model yourself.

1 Like 1 ·
Show more comments

Write an Answer

Hint: Notify or tag a user in this post by typing @username.

Up to 12 attachments (including images) can be used with a maximum of 23.8 MiB each and 47.7 MiB total.