question

Chandler avatar image
0 Likes"
Chandler asked Jason Lightfoot commented

What is the best way to see a chart of patient census by label vs. time?

I think this is best kept simple, so I'm not posting my failed attempts:

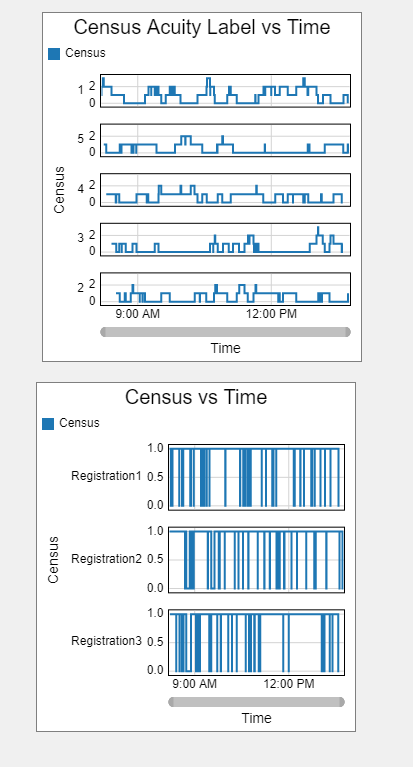
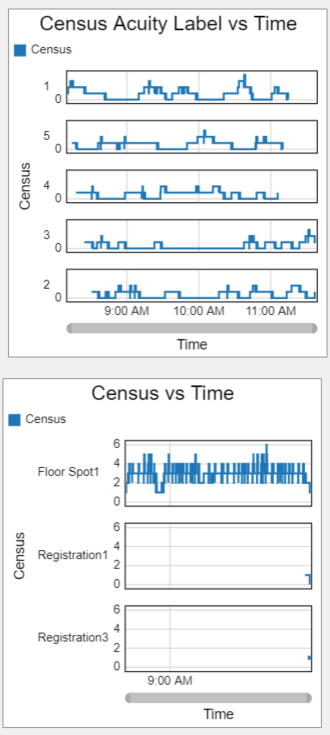
I want to see charts of all of my patient labels over time. For example, I want to see a distribution of acuity values 1-5 vs time in a stacked line or area chart.

I also sometimes store a preferred exam room group on a patient label, and I would want to see how many people have that preferred exam room group so I can compare to the census of that location group.

I've been trying to concoct various statistics collectors and I keep hitting walls (not impossible stuff, just things I haven't encountered yet).


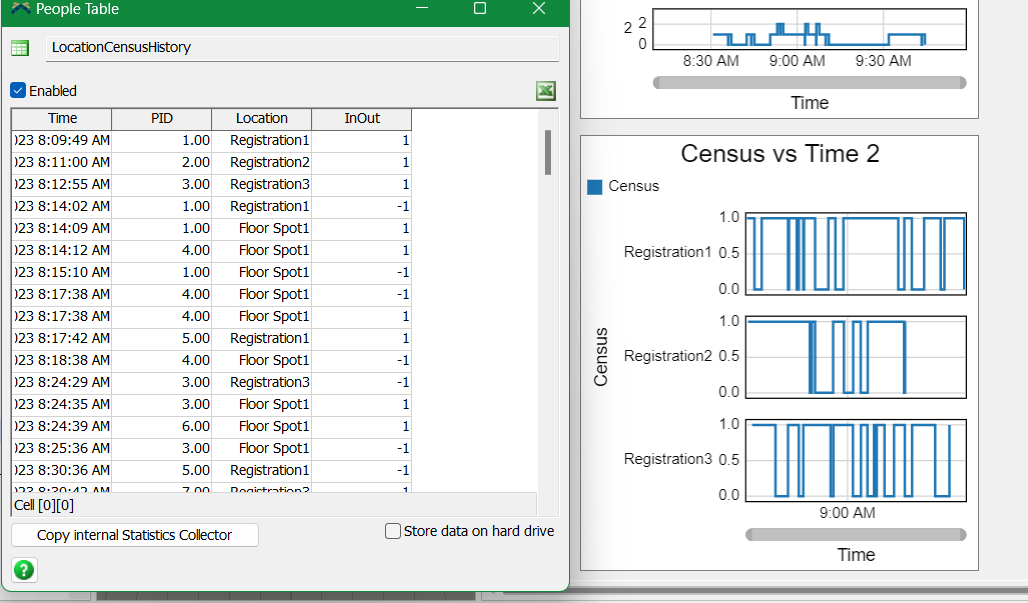
How can I see census this way?

FlexSim 23.1.2
labelshealthcarestatisticscensus
· 1
5 |100000

Up to 12 attachments (including images) can be used with a maximum of 23.8 MiB each and 47.7 MiB total.

Jason Lightfoot avatar image Jason Lightfoot ♦ commented ·

Hi @Chandler, was Jeanette F's answer helpful? If so, please click the "Accept" button at the bottom of their answer. Or if you still have questions, add a comment and we'll continue the conversation.

If we haven't heard back from you within 3 business days we'll auto-accept an answer, but you can always comment back to reopen your question.

0 Likes 0 ·

1 Answer

·
Jeanette F avatar image
0 Likes"
Jeanette F answered Chandler commented

Hello @Chandler,

Does this fit what you are looking for?

I used Census vs time charts and added partitions for the patient labels.

1696386143448.png

Census by label vs time.fsm


· 3
5 |100000

Up to 12 attachments (including images) can be used with a maximum of 23.8 MiB each and 47.7 MiB total.

Chandler avatar image Chandler commented ·

Generally this is the sort of thing I'm looking for, but I think it doesn't work when the labels change over the course of the simulation.

When I update Location, for example, it takes the value for PID from the census chart and looks up the person labels for that PID. Those labels are dynamic, so for example when I set it up so that the Location label changes, the dashboard doesn't maintain the old census by label data.

For things like Acuity that's fine, but for anything that changes (like "Location" here; or an "imagingStatus" label that stores whether a patient needs to get imaging but hasn't completed it yet; etc.)

In the second image below I should see a continuous curve that goes between 0 and 1 for Registration1 and Registration2, but the value is removed.

1696436572281.png

census-by-label-vs-time_dynamic-labels.fsm

0 Likes 0 ·
Jeanette F avatar image Jeanette F ♦♦ Chandler commented ·

Hello @Chandler,

The labels on the patients do not have a history so with the current statistic tables can't show the location label at different points in time.

This information though is stored in the Location Census history.

1696449608060.png

census-by-label-vs-time-dynamic-labels_1.fsm

A custom statistics collector would have to be made to create this table with the labels on the patient but it would be redundant.

0 Likes 0 ·
Chandler avatar image Chandler Jeanette F ♦♦ commented ·
I've been looking at this, and I want to go just a little deeper before accepting a solution.


This works as long as patient labels stay the same over the course of the simulation. I can get by with that for what I need for now, though I'd like to find a way to fix it in the future.


Using location census history is very close to comprehensive. I think it doesn't track the census of a label in cases when a patient briefly has no location acquired, which may happen sometimes but normally the model is built so that it doesn't happen.

The best case source for data would be not the location census history, but the model or process flow census history, and my understanding is that to do that would require a custom statistics collector. (Also I wonder if pushing to a list and charting contents or using a calculated table would be useful)


I'm going to try to use the suggested method for now, but may develop further if a need arises.

0 Likes 0 ·

Write an Answer

Hint: Notify or tag a user in this post by typing @username.

Up to 12 attachments (including images) can be used with a maximum of 23.8 MiB each and 47.7 MiB total.