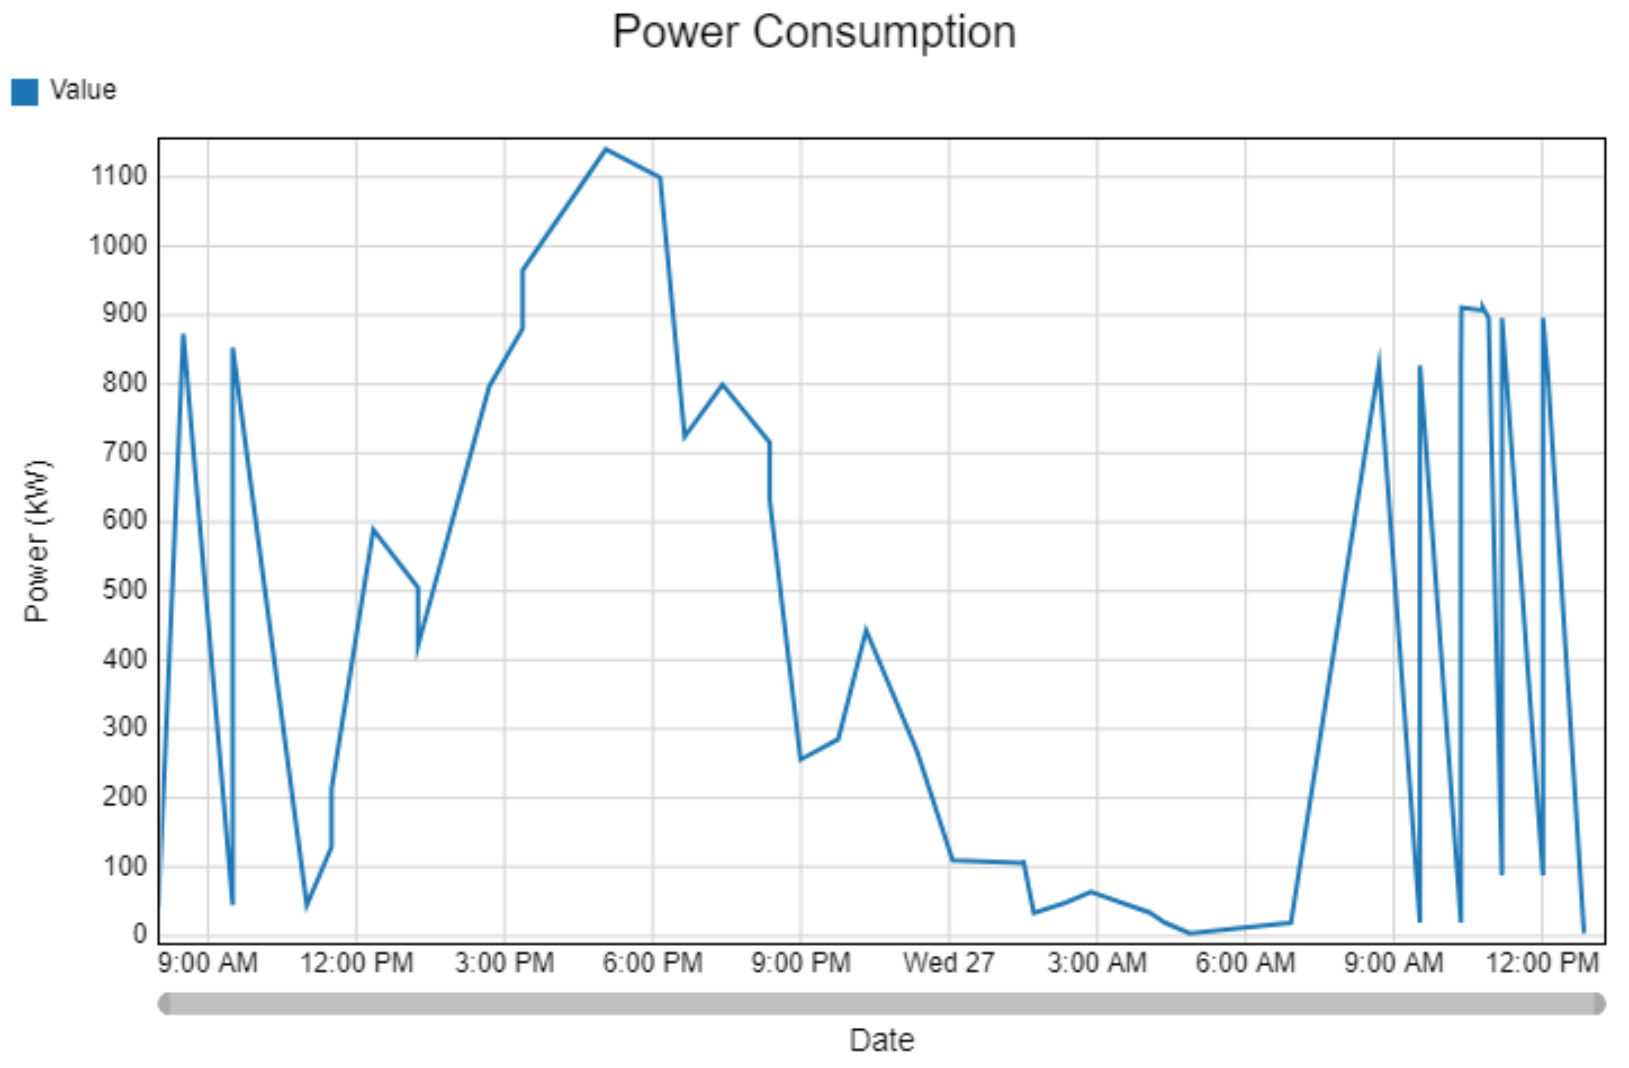
After a model run, I have a chart like this for a tracked variable. Is it possible to identify the run time (hours) where the maximum occurs? I output the CSV but the format is in a date:time format.
Identify exact time for max value of tracked variable
FlexSim 21.2.4
Hi @Kari Payton, was Felix Möhlmann's answer helpful? If so, please click the "Accept" button at the bottom of their answer. Or if you still have questions, add a comment and we'll continue the conversation.
If we haven't heard back from you within 3 business days we'll auto-accept an answer, but you can always comment back to reopen your question.
You could use a calculated table to query the statistics collector table for the maximum value and the corresponding time. (If it's chart template, install its components so you can access the stats collector).
The query would look something like this:
SELECT * FROM TableName ORDER BY Value DESC LIMIT 1

14 People are following this question.