question

Luis Fernando avatar image
0 Likes"
Luis Fernando asked Jeanette F commented

How to get a chart of chair availability in the current time instead average

Hi FlexSim team,


I am trying to get a chart of the Chair or Location availability in the current time.

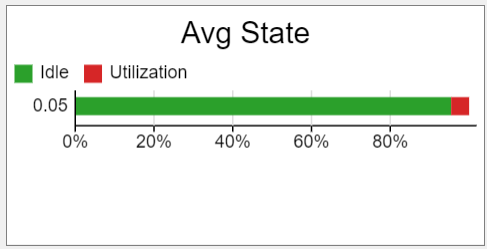
Something similar like this chart (taken from other post):
1714055658998.png

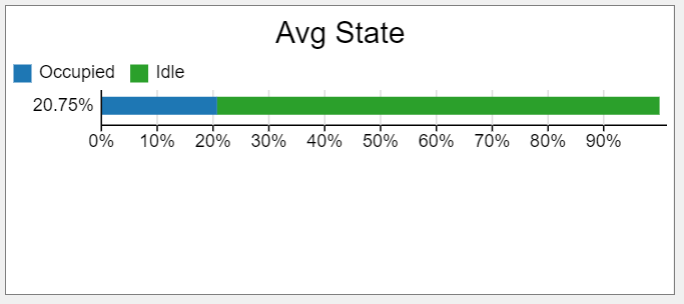
How can I change the chart from average to current availability in porcentage.

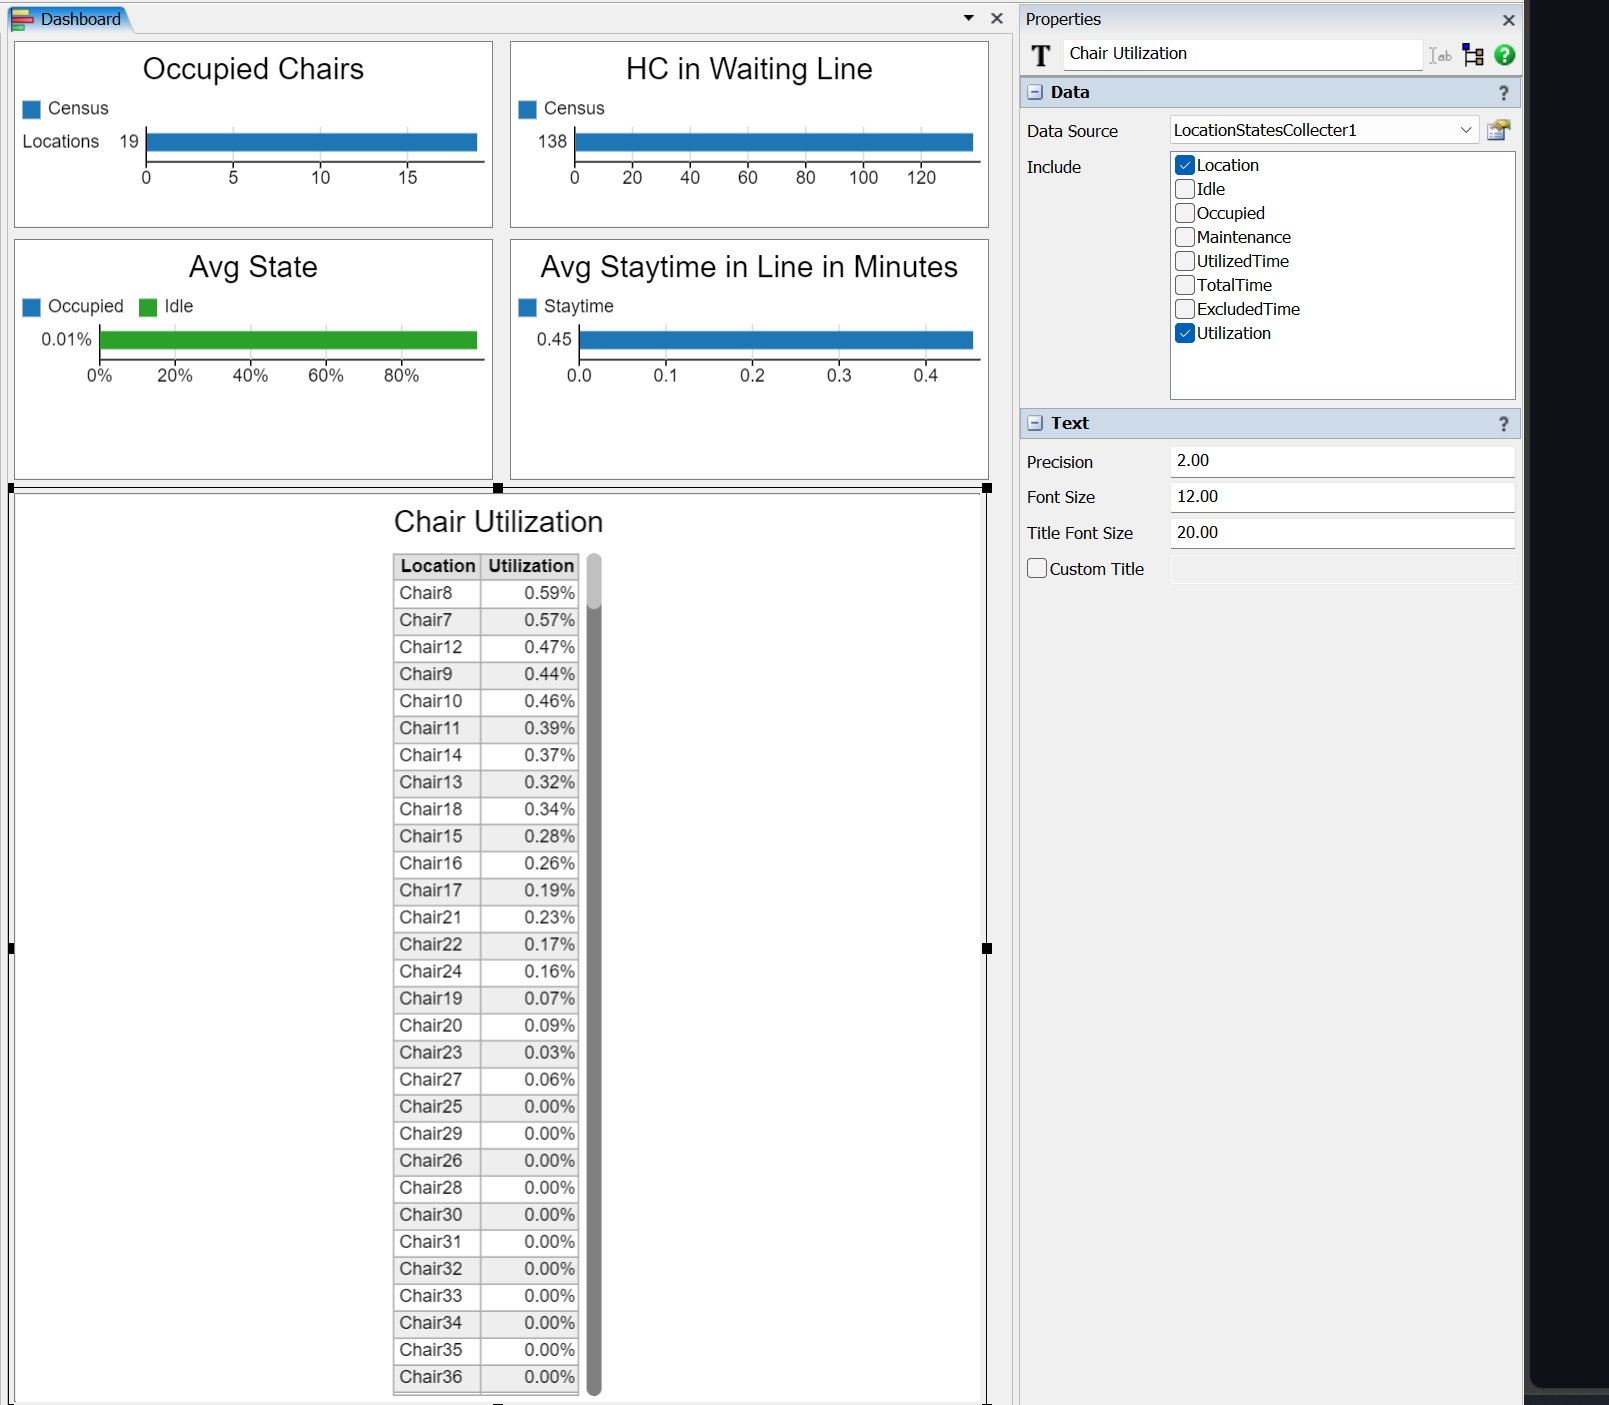
This is how appears in my model:

1714058625508.png


Can you help me with this?

Here is attached the model: 2. Location availability chart.fsm

Thank you


FlexSim 24.0.2
chartschair availability chartlocation chart
· 1
5 |100000

Up to 12 attachments (including images) can be used with a maximum of 23.8 MiB each and 47.7 MiB total.

Hi @Luis Fernando, was Diego Avila's answer helpful? If so, please click the "Accept" button at the bottom of their answer. Or if you still have questions, add a comment and we'll continue the conversation.

If we haven't heard back from you within 3 business days we'll auto-accept an answer, but you can always comment back to reopen your question.

0 Likes 0 ·

1 Answer

·
Diego Avila avatar image
0 Likes"
Diego Avila answered

Hi @Luis Fernando,

You can copy the internal statistics collector from LocationStates, and once you create the statistics collector using a table or bar chart, you can view the chairs utilization individually.

1714072693515.png

2-location-availability-chart_1.fsm


5 |100000

Up to 12 attachments (including images) can be used with a maximum of 23.8 MiB each and 47.7 MiB total.

Write an Answer

Hint: Notify or tag a user in this post by typing @username.

Up to 12 attachments (including images) can be used with a maximum of 23.8 MiB each and 47.7 MiB total.