question

Nicole S2 avatar image
0 Likes"
Nicole S2 asked Jordan Johnson commented

dashboard visualisation

Hi all,

I have one question about the dashboard:

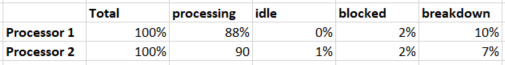
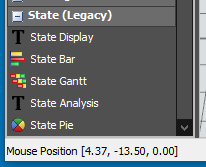
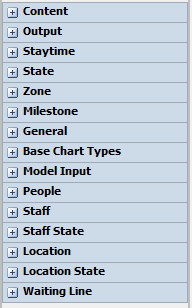
Which diagram do I have to choose in the dashboard that it will put out percentages to all my states(processing, idle, blocked, breakdown) in a chart? The state pie is unfortunately not sufficient enough for me because it only shows one percentage.

This picture is an example for what I need

I use Flexsim Version 19.

Thank you very much!

Best regards,

Nicole

FlexSim 19.1.0
dashboard percentages
qdztx.png (18.0 KiB)
· 7
5 |100000

Up to 12 attachments (including images) can be used with a maximum of 23.8 MiB each and 47.7 MiB total.

Marvin P avatar image Marvin P commented ·

Hello,


i have the same Request like Nicole! I use Version 21.0.5 and the checkbox "Display Legacy Charts in Dashboard Library" in the Global Preferences is not available.

Is there an other simple way to show the different percantages for the states? (like the screenshot above)

Thanks for your help!


Marvin

0 Likes 0 ·
Jason Lightfoot avatar image Jason Lightfoot ♦ Marvin P commented ·

Are they not grouped at the bottom of your widget library?

1645800662942.png


0 Likes 0 ·
1645800662942.png (7.1 KiB)
Marvin P avatar image Marvin P Jason Lightfoot ♦ commented ·

No they aren't...


2022-02-25 15_54_13-Window.png

0 Likes 0 ·
Show more comments

1 Answer

·
Ralf Gruber avatar image
1 Like"
Ralf Gruber answered Nicole S2 commented

Hi Nicole,

I assume you are referring to the "old" Dashboard Widget "State Analysis", that has been deleted from the library with the introduction of the statistics collector. The quick and dirty solution is to just make it available again by

- Opening the global preferences (File/Global Preferences)
- Selecting the "Environment" tab
- Checking the checkbox for "Display Legacy Charts in Dashboard Library" and "Apply"

That enables the use of the legacy charts and now you can add the "State Analysis" from the "State (Legacy)" group in the dashboard library. To do this with the new dashboard widgets required deeper understanding of the statistics collector, calculated tables and the table widget @jordan.johnson.

Does that help for now?

Ralf

· 1
5 |100000

Up to 12 attachments (including images) can be used with a maximum of 23.8 MiB each and 47.7 MiB total.

Nicole S2 avatar image Nicole S2 commented ·

Yes, thank you very much! This is exactly what I wanted.

0 Likes 0 ·

Write an Answer

Hint: Notify or tag a user in this post by typing @username.

Up to 12 attachments (including images) can be used with a maximum of 23.8 MiB each and 47.7 MiB total.