question

pc neo avatar image
0 Likes"
pc neo asked pc neo commented

Flexsim 2020 staff utilization (combined) chart can be sorted?

annotation-2019-12-26-162957.jpg

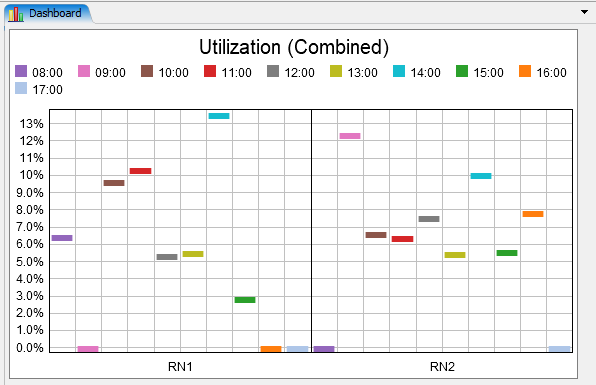
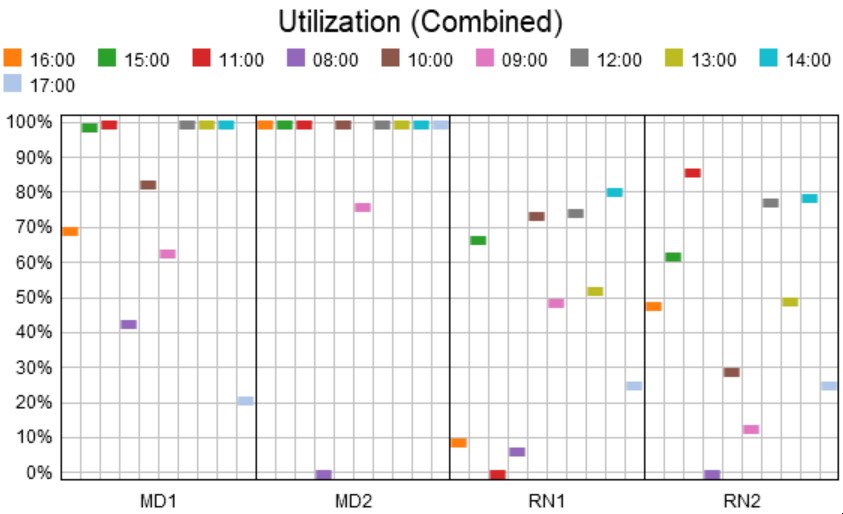
The attached show the chart shown. It is seen that the first slot is 16:00 follorws by 15:00 and so on. they are not sorted from the earliest time to latest time.

Is it possible to have it sorted?

I have tried by installing the chart and "click on sort resullts" in Partition/Sorting in the CalculatedTable, however it gives a lot of errors and chart cannot be shown.

FlexSim 20.0.0
healthcarechart templatesflexsim 2020
· 2
5 |100000

Up to 12 attachments (including images) can be used with a maximum of 23.8 MiB each and 47.7 MiB total.

tannerp avatar image tannerp commented ·

Hi @pc neo,

If you're able to attach a model, we would be happy to help you sort the data. Thanks!

0 Likes 0 ·
pc neo avatar image pc neo tannerp commented ·

@tanner.p thank you. Attached is the model. I've install the chart so a calculated table exist in toolbox.flexsim-hc-phase3-try.fsm

0 Likes 0 ·

1 Answer

·
tannerp avatar image
1 Like"
tannerp answered pc neo commented

Hi @pc neo,

This is actually an easier fix than I thought. All you need to do is grab the labels in the Colors tab of the Box Plot Properties so that they are in the correct order. Reference the GIF below for a demonstration of this.

The chart then reflects that order as shown below.

Hopefully this helps. Let me know if you're looking for something different.

hc-phase3-try-updated.fsm


· 1
5 |100000

Up to 12 attachments (including images) can be used with a maximum of 23.8 MiB each and 47.7 MiB total.

pc neo avatar image pc neo commented ·

@tanner.p Thank you. I didn't expect to be this simple. :)

0 Likes 0 ·

Write an Answer

Hint: Notify or tag a user in this post by typing @username.

Up to 12 attachments (including images) can be used with a maximum of 23.8 MiB each and 47.7 MiB total.