question

Cenk ZR avatar image
0 Likes"
Cenk ZR asked Cenk ZR commented

Stayime longer than the run time of the experimenter

Hello,

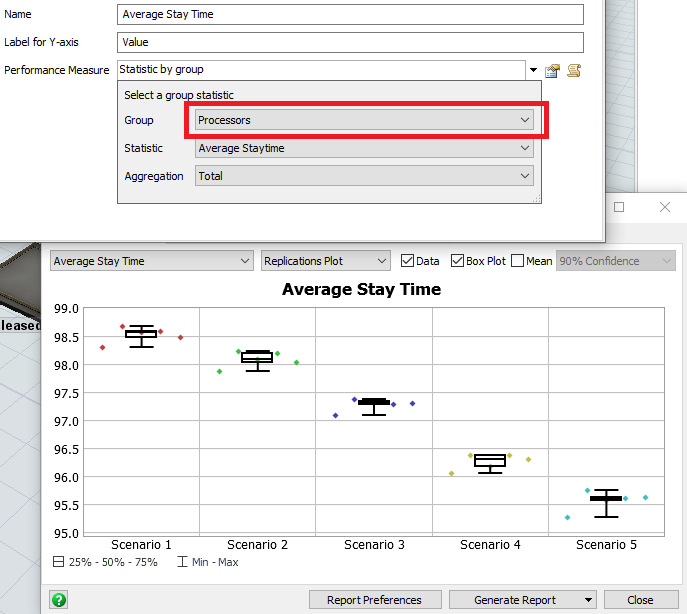
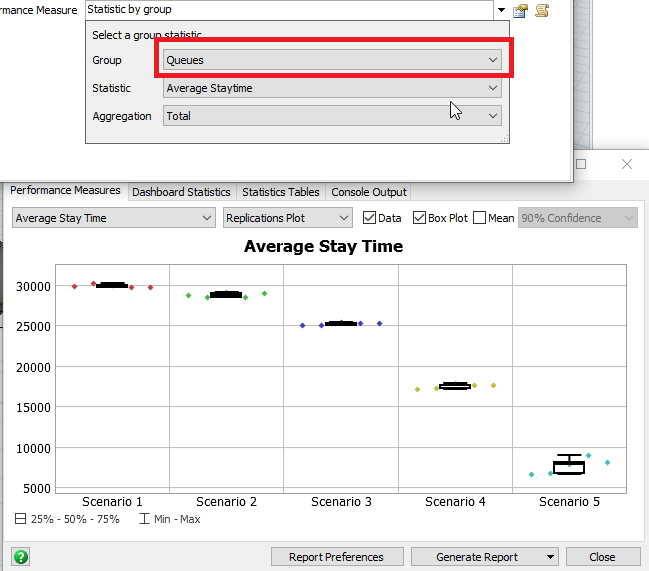
I am using the experimenter for comparing some scenarios. My run time for the experimenter is 28800 seconds. One of my performance measure is the average stay time. Therefore, for the performance measurement, I selected the group, then I selected the statistic as "average stay time" and selected aggregation as "total" because I want to have the total average stay time of an item on that group. However, when I run the experimenter, the average staytime becomes more than 28800 for some scenarios. I did not understand why it is higher than my runtime, if someone can help me with this problem, I would be appreciated. Thank you very much.

FlexSim 19.0.8
experimentergroupexperimenter statisticsrun timestay time
· 2
5 |100000

Up to 12 attachments (including images) can be used with a maximum of 23.8 MiB each and 47.7 MiB total.

tannerp avatar image tannerp commented ·

@Cenk ZR,

Please attach the model you're working with so we can better understand what's going on and provide a solution. Are you using a distribution for your staytime?

0 Likes 0 ·
Cenk ZR avatar image Cenk ZR tannerp commented ·

@tanner.p

Yes, I am using distributions. The group of objects includes processors (process time is based on a distribution), and also there is a queue in that group, which is connected to the source and the interarrival time of the source is a distribution as well. I am attaching my model. Thank you very much.

model.fsm

0 Likes 0 ·
model.fsm (113.5 KiB)

1 Answer

·
tannerp avatar image
0 Likes"
tannerp answered Cenk ZR commented

@Cenk ZR,

I took a look at your model and I'm not 100% positive what the reason is behind the high staytime averages. What I did discover is that there are three factors that will bring the average staytime down below the 28800 second runtime.

1) You had the experimenter looking at ALL the groups' staytimes. This means it included queues, processors, etc. If you include those things, my guess is that the average staytime is projecting very large staytimes because of all the items that sit in queues for a long time (see first picture below). By cutting back what you're measuring to ONLY the Processors (second picture) or ONLY the Queues (third picture) group, you can limit the staytime to something that's more realistic.

2) Another thing that's affecting this is the warm-up time in your experimenter. If you set the warm-up time to 0, the average staytime (for the queues, at least) is limited to less than 28800 seconds.

3) Taking the "Released_orders" queue out of the "All" group and then running the experimenter will produce a much more reasonable average staytime. I think that queue specifically is the bottleneck and it's causing the exaggerated staytimes.

Maybe give these things a look and decide whether you need the average staytime for every 3D object in your model or if you can limit your metric to one group of items or change the groups somehow. All of these options should still allow you to get the "total" average staytime like you wanted. Hopefully this helps!


· 3
5 |100000

Up to 12 attachments (including images) can be used with a maximum of 23.8 MiB each and 47.7 MiB total.

Cenk ZR avatar image Cenk ZR commented ·

@tanner.p

Yes, I need all the objects. My main question is: can the staytime be higher than the runtime ? I run the experiment for 28800 seconds, and have staytime higher than that, because I thought that if I run the experiment 28800 seconds, the staytime should be lower than that anyway but it seems it does not work like that. I am wondering about the reason of this situation. So, my goal is not to try to reduce the staytime value but try to understand how can it exceed the runtime. I am looking forward to hear from you. Thank you for your interest.

0 Likes 0 ·
tannerp avatar image tannerp Cenk ZR commented ·

@Cenk ZR,

Thanks for the feedback. Maybe I wasn't clear about it, but my hypothesis is that "total" staytime is an aggregated value. What I mean by this is that it collects all the staytime information for all the 3D objects and then adds them together.

For example, if I have one processor in my model and I run my model for 100 seconds, the resulting average staytime might be something like 30 seconds. So the total average staytime is 30.

Now, if I add a queue, the average staytime in the queue might be 60 seconds and the processor is 30 seconds. If I take the total average staytime for my model, it's now 90 seconds.

If I add another processor that also has an average staytime of 30 seconds, my total average staytime is now 120 (30*2 + 60), which is longer than my 100 second runtime. Does that make sense? It's the combination of many objects' average staytimes, so it can easily be greater than the runtime.

I tested this by running the "Total average staytime" test for Processor1 only and then Processor2 only and I got values of 13 and 18, respectively. Then when I did the same test on Processor1 AND Processor2 combined, I got a value of 31, which is 13 + 18. So I think that might be the best explanation for the behavior you've described.

0 Likes 0 ·
Cenk ZR avatar image Cenk ZR tannerp commented ·

@tanner.p

It is clear for me now by your explanation. Thank you very much for your interest.

1 Like 1 ·

Write an Answer

Hint: Notify or tag a user in this post by typing @username.

Up to 12 attachments (including images) can be used with a maximum of 23.8 MiB each and 47.7 MiB total.