I have a model where I'm trying to track the min, max, and average amount of each type of item in a group of queues. For example, in the attached model I have 4 different types of items stored in 3 different queues until a processor is available to process them. I want a table in the dashboard that shows the min, max, and average content of each of the 4 item types in the 3 queues. The table doesn't need to show the statistics for each queue, but rather the overall statistics for all the queues combined. How would I do this? I've gotten close using zones in process flow, but I can't figure out how to make only the token for the object that exited fire in the wait for event activity. I'm also open to doing this in a statistics collector if that's easier. Thanks in advance.
Collecting the min, max, and average content of a group of queues by item type.
FlexSim 20.1.3
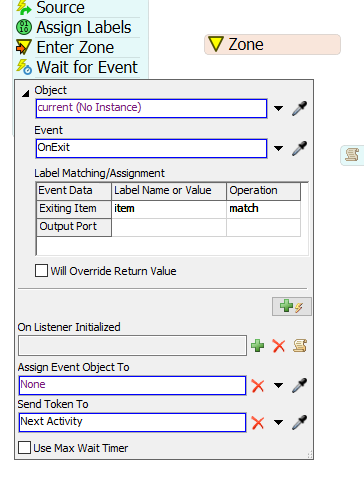
Change Wait for Event as shown in below image.

19 People are following this question.