What would be the best way to export the Person Milestone Table under the people statistics tables in the toolbox as one file after an experimenter run? I've created a chart in the dashboard that copies the statistics collectors for this table. I then created a scenario chart in another dashboard referencing the original chart in the dashboard but I get a few error codes after the experimenter run.I'm wondering if there is a table already created that has this table for each simulation run?
Along with checking the box as per @cliff.king's answer, you can make a calculated table that gathers all the data from the most recent experiment, with this query:
SELECT * FROM Experiment.PersonMilestones
Note that to write that query, you'll have to "enable direct editing" on the calculated table.
Once you have that table, you can add it to the Excel Export.
Is there any easy way to convert the decimal format back to the original time format? When I update the table is lists the value as a decimal number.
I always like Jordan (@jordan.johnson) to weigh in on these type of reporting questions, but I think it is just a matter of checking these two boxes...
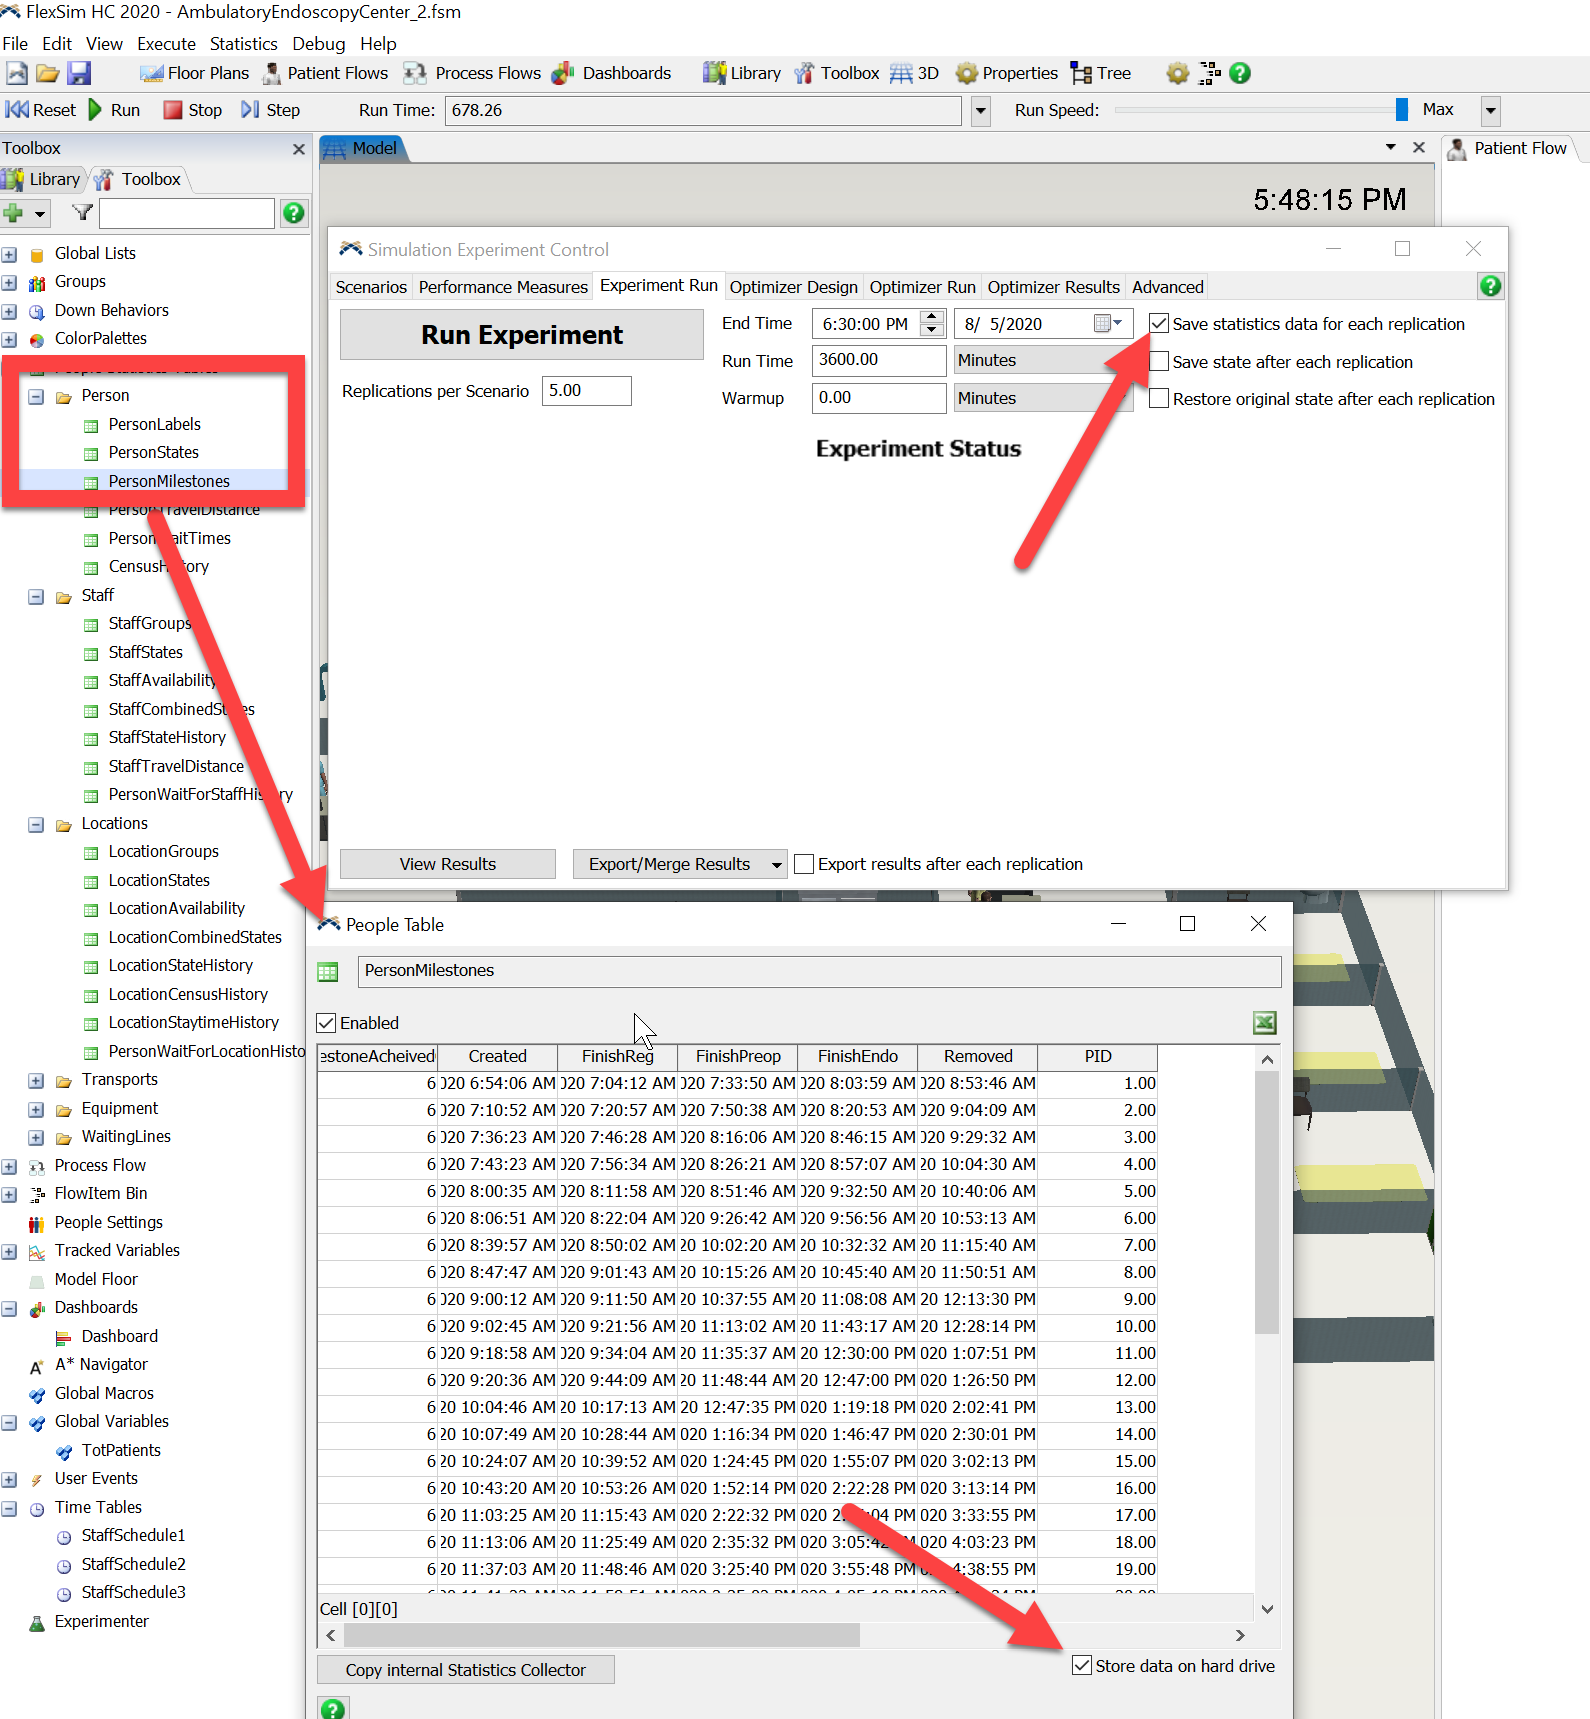
The "Store Data on hard drive" is unrelated. You do need to check the "Save statistics data for each replication" box, though
I think they are all checked by default except the store data on hard drive. It works fine with one replication but I can't seem to get the data after the experimenter run with multiple replications.
Without a model, it's difficult to say. You might be running in to bugs. I'm not sure what you mean by " I've created a chart in the dashboard that copies the statistics collectors for this table." Do you mean that the chart uses that table as a data source? And are you then using that chart as the source for a Scenario Chart? If so, and it isn't working, then there may be some bugs.
But that's a different question than trying to export the data to a file, say to Excel. For that, you can use Calculated Tables and the Excel Export. But that's if you want to export the raw data. What are you hoping to export?

14 People are following this question.