In the attached model, I"m trying to figure out why I have a discrepancy with the milestone to milestone times and the avg milestone times charts. The Avg Milestone Times chart and Patient Staytime charts seem to be in sync, however when I add up the individual times from the Milestone-Milestone chart it shows that the actual staytime is longer. I've narrowed it down to "Decide Biopsy to Patient Enters Procedure Room Milestone" which shows 65.5 minutes.However, when looking at the Avg Milestone Times chart the difference from "Patient Enters Procedure Room Milestone" to "Skin Exam End Milestone" is showing 51 minutes. These numbers should be relatively close but I'm not sure why the difference is there.
Milestone to Milestone vs Avg Milestone Times
FlexSim 20.2.1
Also, I noticed that my "Decide Biopsy" milestone has a shorter average time than the "Skin Exam End" milestone even though it comes later in the patient flow. These numbers should be the same unless there's a delay at the "Biopsy Decision" decide activity somehow?
All these numbers are averages, but each of the numbers you're looking at have a different number of data points being averaged. For example, here's some of the data in the PersonMilestones table:
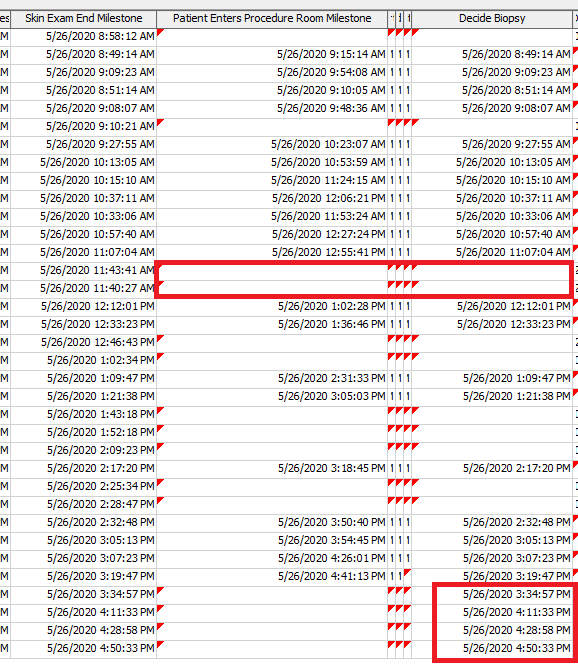 Notice that every patient hits the Skin Exam End milestone, but not the Decide Biopsy or the Enter Procedure milestone. This is why the Decide Biopsy is shorter than the Skin Exam End. There are some patients who hit the Skin Exam End later than average, but then never went to the Decide Biopsy milestone.
As for the original question notice the red box at the bottom right. There are some patients at the end of the model who hit the Decide Biopsy milestone, but still haven't hit the Enter Procedure Room milestone. The Milestone - Milestone chart ignores those extra data points because it needs both numbers to calculate the difference. However, the Average Milestone chart is using all the available data points, meaning: the Decide Biopsy average number has some extra data points that is changing the number that is displayed there.
Ahh I see, so I should either let the model run longer to get these values or just use the Milestone-Milestone chart (which would be more accurate given the model stops at 5pm)?
The Milestone-Milestone chart is the more accurate one for periods between milestones, so yes, use that one in this case. But the Average Milestone numbers are still accurate by themselves. Knowing that patients on average reached Skin Exam End 113 minutes into their LOS is still useful. Just don't subtract those numbers from other ones in the chart and don't compare milestone times for milestones that not all patients hit.

10 People are following this question.