question

SudheerReddy avatar image
0 Likes"
SudheerReddy asked Ben Wilson commented

trying for time plot for work in process token labels

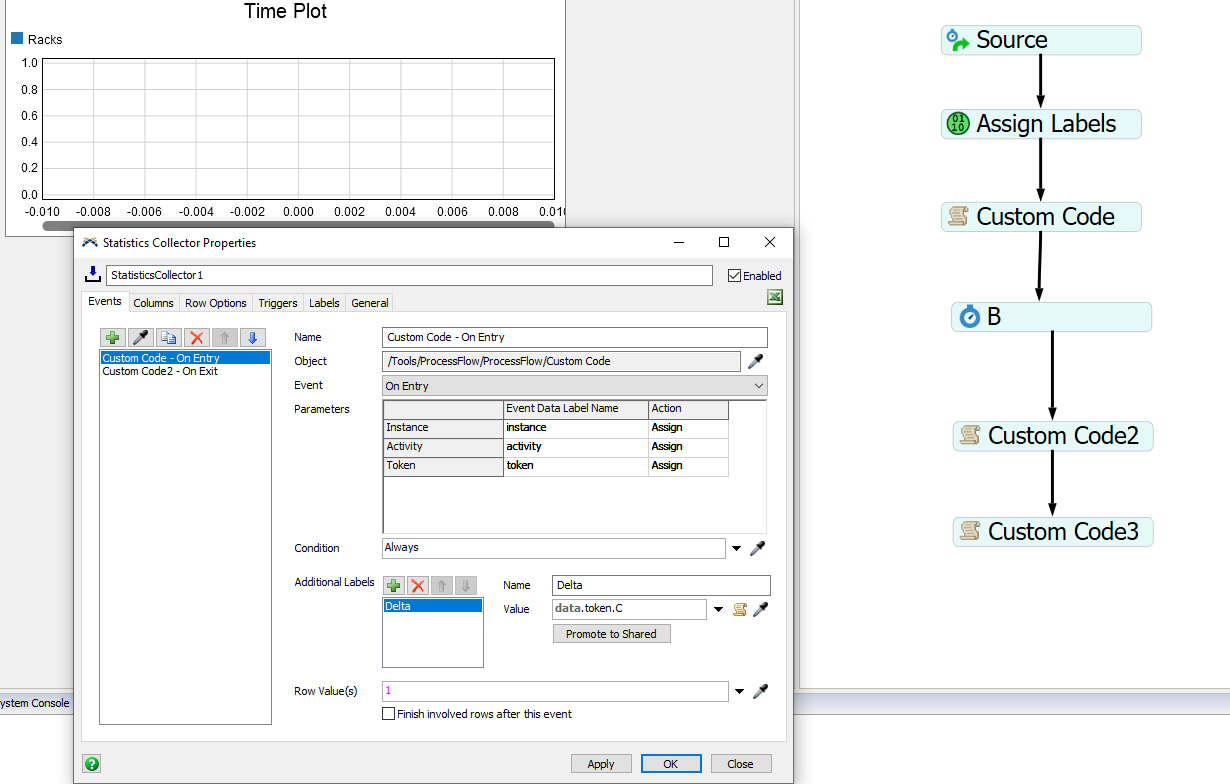
I am trying to capture cumulative value of particular token label i.e. between Custom code - On entry and before Custom Code-2 on Exit.

Every time a token enters Custom code I am trying for time it enters and the cumulative value of particular label and every time a token exists also cumulative value should be updated by subtracting from the total value.

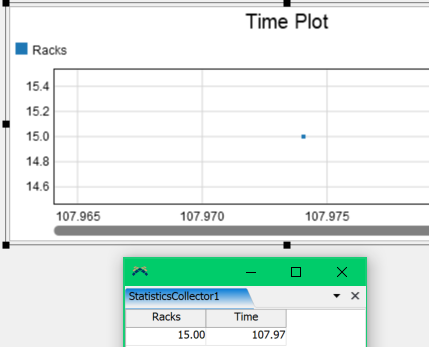
I have successfully updated the time and cumulative value. But not able to achieve the time plot.

stats.fsm


FlexSim 20.1.3
flexsim 20.1.3statistics collector
1614180048501.png (95.3 KiB)
stats.fsm (480.2 KiB)
· 4
5 |100000

Up to 12 attachments (including images) can be used with a maximum of 23.8 MiB each and 47.7 MiB total.

Jeanette F avatar image Jeanette F ♦♦ commented ·

Hello @SudheerReddy,

If you open your statistics collector, go to the general tab and select view table you will see the statistics being gathered. Currently the statistics keeps track of the number of tokens between custom cod and custum code 2 and the time that has elapsed since the beginning of the simulation. Your plot does plot the single data point in the table.

From your description above you are wanting to keep track of the quantity of tokens in that part of the process flow, however I do not understand what time you are trying to keep track of. Could you explain that?

0 Likes 0 ·
1614272886575.png (23.5 KiB)
SudheerReddy avatar image SudheerReddy Jeanette F ♦♦ commented ·

@Jeanette F... I am looking for time plot as line plot which shows all the history of entries. As of know it is showing only one single point which doesn't show all the previous points.

0 Likes 0 ·
Jason Lightfoot avatar image Jason Lightfoot ♦ commented ·

This is a later post than this duplicate. Please only post once.

0 Likes 0 ·
Ben Wilson avatar image Ben Wilson ♦♦ commented ·

Hi @SudheerReddy, was Jeanette F's answer helpful? If so, please click the red "Accept" button at the bottom of their answer. Or if you still have questions, add a comment and we'll continue the conversation.

If we haven't heard back from you within 3 business days we'll auto-accept an answer, but you can always unaccept and comment back to reopen your question.

0 Likes 0 ·

1 Answer

·
Jeanette F avatar image
0 Likes"
Jeanette F answered Jason Lightfoot commented

Hello @SudheerReddy,

As I was trying to figure out the statistics collector I realized that the zone activities do exactly what you are asking. You can place the enter and exit zone in the places you want to track the current number of tokens and the time plot.

I will attach your model with the zones implemented and the chart.

Zone tracks content vs time.fsm


· 2
5 |100000

Up to 12 attachments (including images) can be used with a maximum of 23.8 MiB each and 47.7 MiB total.

SudheerReddy avatar image SudheerReddy commented ·

@Jeanette F Zone will give only number of tokens vs time. But I am not looking for number of tokens vs time....Each token has label called "C"...I am counting the label "C" here....

0 Likes 0 ·
Jason Lightfoot avatar image Jason Lightfoot ♦ SudheerReddy commented ·

Here's the model from your other post.

stats_jl.fsm

0 Likes 0 ·
stats-jl.fsm (33.7 KiB)

Write an Answer

Hint: Notify or tag a user in this post by typing @username.

Up to 12 attachments (including images) can be used with a maximum of 23.8 MiB each and 47.7 MiB total.