I have model where the complexity and time constraints don't really give me the luxury of using the experimenter. As a result, I was wondering if there was a way to run multiple replications such that the Statistics and Reports tab can collect the data?
Running Multiple Replications
FlexSim 16.1.0
Why exactly do you think you can't use the experimenter?
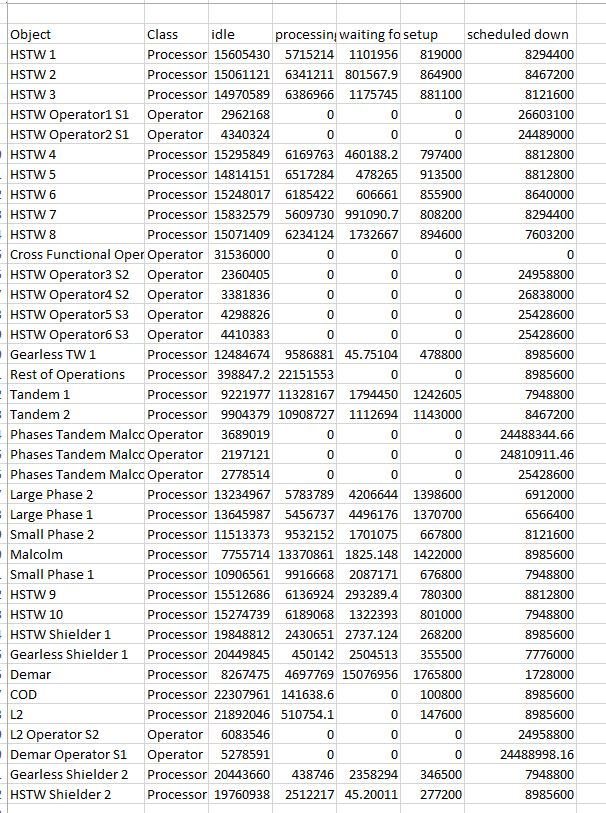
There is a lot of data from at least 30 different objects that I need to collect and I cannot find a way to centralize all of that data in one location and export to Excel. The Reports and Statistics tab has a lot more depth in terms of raw data.
Furthermore, my different 'scenarios' don't seem compatible with the experimenter. For example, I have three shifts of workers but when I experiment with adding more workers, I can't specify which shift to add them to. Also since I haven't categorized my processors into 'groups' I can't change that either.
I don't really mind making multiple models to test my various scenarios but I would really like to be able to have an easy to access place for all of the raw data for one run.
I have attached all of the data that I want to output from one of the models. Is there a way to manipulate data on this scale with the experimenter? From my experience, every single performance measure has a raw data section but can only be accessed individually.
I want to be able to access all of my performance measures for a set of replications in one block of raw data. Is that possible in the experimenter?
@Tony Nikolov There is a way to accomplish these things with the Experimenter. I'm working on your answer and will get back to you soon.
Looking at your follow-up questions, it seems that there are two main things you want to do with the Experimenter:
- Add an operator to a specific shift in the Experimenter.
- Access data from all of your performance measures in one place.
For your first question, you can run a code in the Experimenter to join an operator to a specific time table in the model tree. It is run in the "Start of Replication" code of the "Advanced" tab in the Experimenter. This is what it would look like, only with the specific names and locations for your model:
treenode operator = node("Operator8", model());
treenode timetable = node("Tools/TimeTables/TimeTable1", model());

treenode operatorTimeTableNode = nodeadddata(nodeinsertinto(getvarnode(operator,"timetables")), DATATYPE_COUPLING);
treenode timetableMemberNode = nodeadddata(nodeinsertinto(getvarnode(timetable,"members")), DATATYPE_COUPLING);

setname(operatorTimeTableNode, getname(timetable));
setname(timetableMemberNode, getname(operator));

nodejoin(operatorTimeTableNode, timetableMemberNode);
For your second question, you can access your performance measure data in the tree. Under Tools->Experimenter->Performance Measures you can select each performance measure and look at their stats.
You could do this by running the model multiple times and collecting a report for each one. In the Statistics tab you should first unselect the "Repeat Random Streams" option so that every model run is different. Then arrange your Summary Report or State Report as needed. You can then set a model trigger for "On Run Stop", which will execute the given code whenever the model is stopped. The following is the code if you are generating a summary report and below that for a state report.
Summary report:
string directory = modeldir();
if (stringlen(directory) < 3)
    directory = documentsdir();
string filepath = concat(directory,"summaryreport.csv");
fileopen(filepath);nodefunction(node("/project/exec/globals/nodefunctions/summaryreport",maintree())); // This functionality had to be C++
fileclose();
State report:
string directory = modeldir();
if (stringlen(directory) < 3)
    directory = documentsdir();
string filepath = concat(directory,"statereport.csv");
fileopen(filepath);nodefunction(node("/project/exec/globals/nodefunctions/statereport",maintree())); // This functionality had to be C++
fileclose();
Thanks, but if I do that then it will take ages to average out all of my data into one form for several replicates. Is there really no way to compile one report that averages out the stats of every replicate?
8 People are following this question.