Hello,
Does anyone know how can I plot the value of a label of an object on a Queue?
I have tried the figure content vs time, and then tried to plot Content(i).LabelName; but it didn't work.
Thanks
Hi~ @Ana Ta
I think you maybe not quite familiar with the new chart which should use the Collected Table.
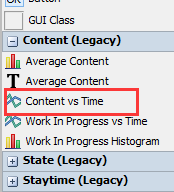
It's very simple in Content vs Time chart in Content(Legacy), See the pic below.
I attach a demo model for plotting the value of label-"num" in queue with both legacy way and new way. We have to use Statistics Collector to collect the data we want in model before display it in dashboard.
dashboards-timeplotbychjv172.fsm
Hope it helps~
7 People are following this question.
© 1993- FlexSim Software Products, Inc. All Rights Reserved.
FlexSim is a fully 3D simulation software environment. FlexSim can be used to simulate any process in any industry.
FlexSim®, FlexSim Healthcare™, Problem Solved.®, the FlexSim logo, the FlexSim X-mark, and the FlexSim Healthcare logo with stylized Caduceus mark are trademarks of FlexSim Software Products, Inc. All rights reserved.
