question

Anggoro P avatar image
0 Likes"
Anggoro P asked Raja Sekaran answered

Making a list in table chart

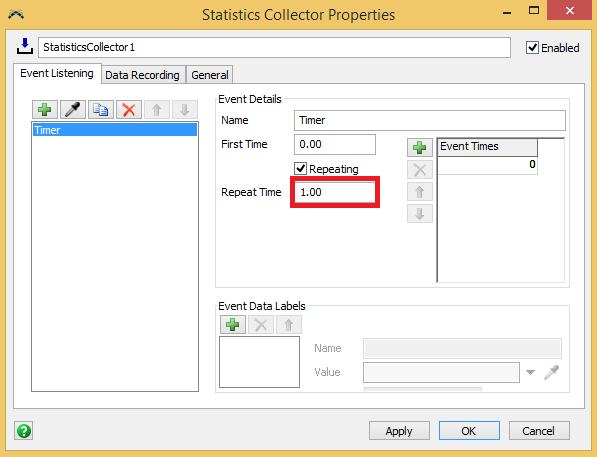
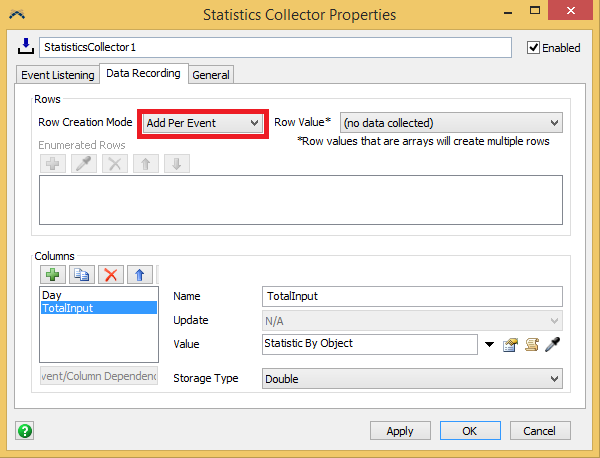
Hi, I want to make a table chart that list the content of an object overtime. The simulation time unit is day and I want to review the content everyday and add a new row in my table chart. I have tried making the chart, but it seems to be accumulating the content and only creating one row which updated everytime.

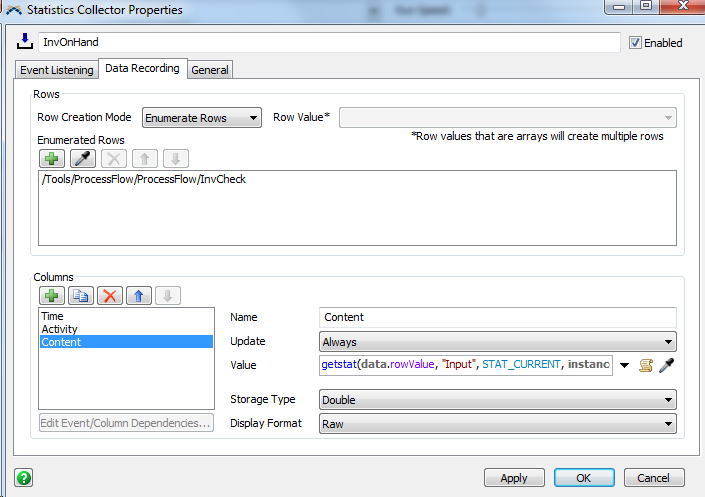
Anyone knows what I made wrongly?

Choose One
statistics collector
untitled.png (43.6 KiB)
· 1
5 |100000

Up to 12 attachments (including images) can be used with a maximum of 23.8 MiB each and 47.7 MiB total.

Anggoro P avatar image Anggoro P commented ·
0 Likes 0 ·

1 Answer

·
Raja Sekaran avatar image
0 Likes"
Raja Sekaran answered

Hi @Anggoro P

Add Per Event - Row Mode is ideal for timer events. It will create a row every time when timer event fires. In the attached model, Added Timer Event and Specify time interval as shown in the pic below.

Choose Add Per Event as a Row mode

statisticscollector-support.fsm

Hope this helps.

Thanks.


5 |100000

Up to 12 attachments (including images) can be used with a maximum of 23.8 MiB each and 47.7 MiB total.

Write an Answer

Hint: Notify or tag a user in this post by typing @username.

Up to 12 attachments (including images) can be used with a maximum of 23.8 MiB each and 47.7 MiB total.