question

muyuan.li avatar image
0 Likes"
muyuan.li asked muyuan.li commented

InPatient Staffing: Record patients activity and write in global table

Objective: Develop staffing models at an observation unit to reduce the difference between patients workload ((# existing + # admits + # discharge)/RN Patient Ratio) and # of nurses by hour of day

Problems:

Understand hourly patients workload --> # of admit

Test different nurse staffing models (# of nurses will be varied by hour of day --> staggered shift)

Simulation Challenges:

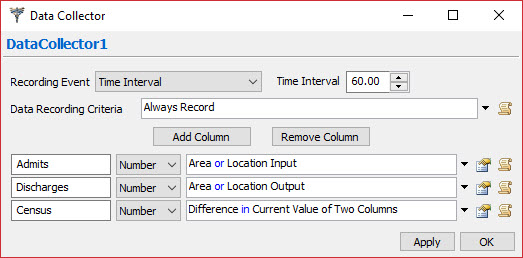
  • 1.Record # census in bed area at the beginning of every hour
  • 2.Record # of patients admitted (enter) to bed area every hour
  • 3.Record # of patients discharged (leave) bed area every hour
  • 4.Write these data in a global table and save as .csv file

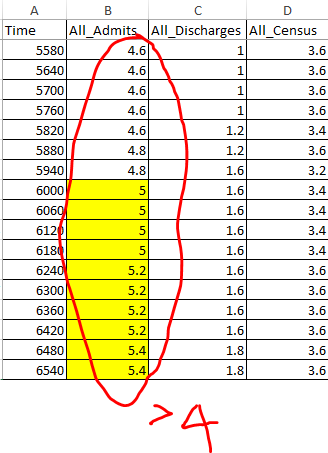
An example of 7-day experiment, I want a global table with data as shown below:

Begin Hour End Hour # Starting # Admits # Discharges
01:00:00 01:00:59
01:01:00 01:01:59
….
07:11:00 07:11:59

I am not sure how to track # values. I think a custom code may be needed to create data collector and coding is required to write information into a global table. Would you please help?

Thank you in advance!

I created a sample model for your convenience. Once I understand how to record data and write data into global table, I will develop a model with actual data. observation-unit-staffing-model-test.fsm

FlexSim HC 5.3.4
global tablecustom codedata collector
5 |100000

Up to 12 attachments (including images) can be used with a maximum of 23.8 MiB each and 47.7 MiB total.

1 Answer

·
Cliff King avatar image
0 Likes"
Cliff King answered muyuan.li commented

You could possibly use the standard Location Throughput and Location Census dashboard widgets to collect the information you desire and then export the dashboard data to csv files, but then you would have some extra work on the post processing side to combine the data in the way you want. Therefore, I would suggest using the Data Collector tool to capture the data exactly the way you want. I set up a data collector and user-defined chart in the attached model. Thank you for sending a test model for me to use!!

Here's the properties of the Data Collector I used in the model. Notice, I used "Time Interval" as the Recording Event with an interval of 60 minutes. I don't think you need to create another data collector for the 59 minute mark, because the start of one period can also count as the end of the previous period.

observation-unit-staffing-model-test-2.fsm

I've also attached three more small example models demonstrating the use of the Data Collector that I have in my library. The overtime model demonstrates how to create your own custom event in tandem with a Data Collector for those special cases where none of the standard Recording Events match what you need.

display-activity-parameter-for-multiple-activities.fsm

patient-activity-wait-time-tracking-model.fsm

clinic-overtime-example-with-custom-data-collector.fsm


· 3
5 |100000

Up to 12 attachments (including images) can be used with a maximum of 23.8 MiB each and 47.7 MiB total.

muyuan.li avatar image muyuan.li commented ·

Hi, @Cliff King

I ran the model and pulled the report, but have some questions.

1. Census

Census = Previous Census + admits - discharges (In the table, the census is not correct)

But I think I can manually calculate this part if I can record data by hour and by replications (experiment run).

2. Admits

Admits = # of patients enter bed area every hour. There are only 4 beds in the bed area. I wouldn't expect the admits value exceed 4. However, in the table, there are values more than 4.

Is this data collect tracking # of patients admitted to bed area during that particular hour? Or accumulated # of patients admitted to bed area before that particular hour? Can I track # of admits during the particular hour.

Thank you very much for all your help!

Muyuan

0 Likes 0 ·
census.png (15.6 KiB)
admit.png (19.3 KiB)
Cliff King avatar image Cliff King commented ·

Take a look at the three columns I defined on the data collector. Column 1 that I renamed "Admits" is recording the number of patients who have entered the BedArea since the model began, Column 2 that I renamed "Discharges" is recording the number of patients who have exited the BedArea since the model began, and Column 3 which I renamed "Census" is simply taking the current value for Column 1 and subtracting the current value for Column 2.

I apologize if my column names were confusing you. You can add as many columns as you want for a data collector and define anything you want to record as the value for the columns. Hopefully the value you want to record in a column can be defined with one of the drop down pick list options, but if not, you can write your own expression for something to record. If you need help with a custom expression, let me know.

Because you plan on running an experiment, you should add a column to record the current scenario number, and another column to record the current replication number. These are standard pick list options for a data collector.

0 Likes 0 ·
muyuan.li avatar image muyuan.li commented ·

Thank you for the explanation. That's clear now @Cliff King

0 Likes 0 ·

Write an Answer

Hint: Notify or tag a user in this post by typing @username.

Up to 12 attachments (including images) can be used with a maximum of 23.8 MiB each and 47.7 MiB total.