Hello,
When using event "On Staytime Change" in statistics collector, how do I get the item that causes staytime changing?
Hello,
When using event "On Staytime Change" in statistics collector, how do I get the item that causes staytime changing?
The involved item is not available with the OnChange events. You can listen to the OnEntry of the next object, which will give you and involved reference. When that event occurs, the previous object's staytime will reflect the time that the involved spent in the current object.
Another option is to use a Statistics Collector. This has the advantage of being able to track items across multiple objects, but can also be used in your case. Here is a demo model:
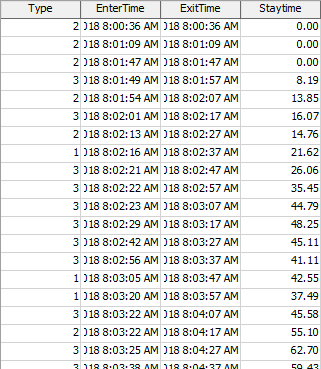
The Statistics Collector is listening to the OnEntry and OnExit of the Queue. It makes one row per flow item. When the item enters the queue, the collector records the item's type and the current time. When the item exits the queue, the collector records the current time, as well as the difference between the current time and the entry time. This produces the information you want:
@jordan.johnson Thank you.
By the way I add a time plot to display ExitTime vs StayTime, but the chart doesn't update correctly. Switch to another page and switch back will fix this.
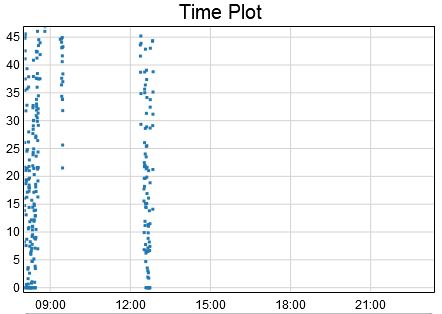
The timeplot assumes that values don't change, once they are added to the chart. In your case, you are changing values from null to a time value. Right now, the only way to get the chart to re-evaluate rows in the bundle is to set the Y Axis Range option to Adaptive. In your case, I think that will display the data you want.
3 People are following this question.
© 1993- FlexSim Software Products, Inc. All Rights Reserved.
FlexSim is a fully 3D simulation software environment. FlexSim can be used to simulate any process in any industry.
FlexSim®, FlexSim Healthcare™, Problem Solved.®, the FlexSim logo, the FlexSim X-mark, and the FlexSim Healthcare logo with stylized Caduceus mark are trademarks of FlexSim Software Products, Inc. All rights reserved.
