Hello guys,
I am working with 3 cranes and need to measure the utilization of each one of them.
Using the default utilization pie chart isn't doing the job, because it only tracks the state changes against Idle but a lot of times my cranes are 'Idle' while waiting other cranes load/unload but in reallity it should be considered as "busy" because it has already received a task.
I thought about working around it using a trigger that sets a Label 'craneX_Req' == 1 on Task Start and 'craneX_Req' == 0 on Task Finish. This label with value of 1 represents perfectly the real utilization of my cranes.
The question is: how can I measure the total time a label stays on the system so I can relate it to the simulation total time and make a pie chart for the real utilization of my cranes?
I tryed using "event-triggered source" + "wait for event" listening to the Start and Finish Task of my crane and then measure the stay time of the tokens inside this logic, but I'm still noob with process flow so I coudn't do it properly... Anyone think this could be a solution and maybe could give me a hand with this?
Thanks!
Gabriel.
Is there a way to measure the time a Label stay on the system?
FlexSim 19.0.1
@Gabriel DOM2
Were you able to get it to work, or do you still need help? If you upload your model and explain the duration a crane would be considered Utilized, a simple process flow zone could be created that you would be able to pull statistics rather easily and place in the dashboard and we can help with that.
Thanks Joshua! I can't upload my model because it already has to much classified information but I would really appreciate directions on how to use process flow Zones to measure a resource utilization on a dashboard. Can you explain it to me or send me a link to a tutorial or such?
@Gabriel Morgant
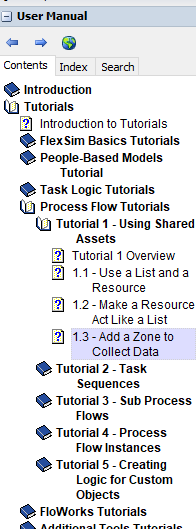
The picture below gives the path to the tutorial.

Zones are extremely useful and have a ton of statistics you can pull from them.
Zone are just what they sound like. You can place "Enter Zone" and "Exit Zone" process flow activities anywhere you want to. You can limit the number of tokens in a zone based off a number, or based off other calculations. In your model's case it is going to be as simple as putting Enter and Exit just where you consider the Crane "Utilized", and there are several dashboard options for zones to chose from of how you want the data displayed. You can even partition the data based on each crane. Let me know if you have anymore questions , you can even just send the process flow activities block by itself and I can help you set up the logic if you need more help.
Hey Gabriel.
I set up a model, where I have added a tracked variable label to an operator. Make sure it is set to categorical if you want to use it for states:
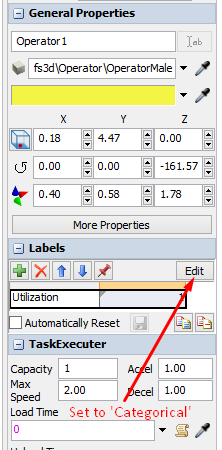
Then I simply set the utilization to 1 or 0 depending on whether the operator has a task.
Check the script window in the attached model to see how I get the utilization from the operator.
I still think you could use the built-in utilization pie chart with a little twist or two, but if you wish to to build the logic from scratch, this should serve as a nudge in the right direction. :-)
Best regards
Christian
@christian.norregaard
Your solution is exactly what I'm looking for but I want it to be on a dashboard... You said it could be done with a twist or two in a default state pie chart, could you help me with those 'twists'?
I really need it to be a pie chart on a dash board but I'm not sure how to implement the script logic there..

18 People are following this question.