question

Dillan J avatar image
0 Likes"
Dillan J asked Dillan J commented

Items in circulation on conveyor

Hello,

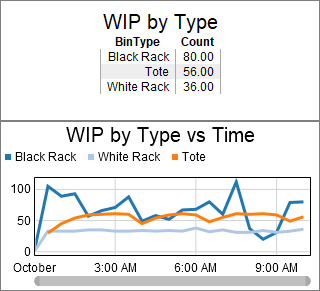
I need help figuring out how to sum and display (or graph vs time) the current content of every conveyor in my system separated by item type/label. Ive tried a few things like WIP vs Time but cant seem to figure it out. Ive tried to find a variable that exists like conveyor.currContent but i cant identify if a variable like that exists or if there is an easier way to do it than to write that line for every conveyor in the system (over 50 sections).

It would also be helpful if i could do the same with the number of items in the entire system that have not yet hit the sink.

2019-24s-delay.fsm

Thanks

Choose One
conveyorstatistics collectorstatistics
2019-24s-delay.fsm (10.3 MiB)
5 |100000

Up to 12 attachments (including images) can be used with a maximum of 23.8 MiB each and 47.7 MiB total.

1 Answer

·
Jordan Johnson avatar image
1 Like"
Jordan Johnson answered Dillan J commented

Are these the charts you are looking for?

The show the total WIP on all conveyors by type.

I didn't use one o the chart templates. I make a Statistics Collector that, every 30 minutes, totals the number of items on all conveyors by type. Then I made a Time Plot that displays that data.

24s-delay-charts.fsm


type-vs-time.png (19.1 KiB)
· 1
5 |100000

Up to 12 attachments (including images) can be used with a maximum of 23.8 MiB each and 47.7 MiB total.

Dillan J avatar image Dillan J commented ·

This is exactly what i was trying to do. Thank you!

0 Likes 0 ·

Write an Answer

Hint: Notify or tag a user in this post by typing @username.

Up to 12 attachments (including images) can be used with a maximum of 23.8 MiB each and 47.7 MiB total.