When running the experimenter, I found in previous versions of HC that the dashboard would update after all replications were completed and the widgets would show the average of all replications. In 20.0.2 is there a way for the charts to show the average of all replications? Specifically, I'm looking in the "Dashboard Statistics" tab after I click View Results after the experimenter replication runs. I can look at each replication individually, which is nice, but is there a way to merge all replications so I can see the average across all replications?
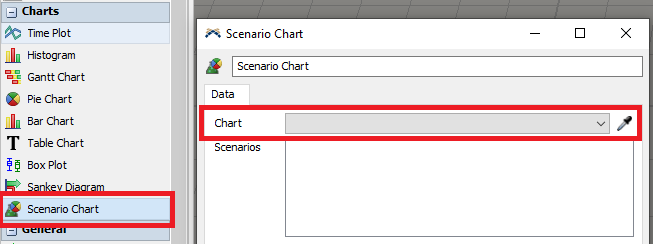
You want to use a Scenario Chart. Add one to your dashboard and then point the Scenario Chart at some other chart.
It might take some getting used to, but the data generated by a single model run is separated from the data generated by an experiment run. This can be nice though because resetting and running a single model run won't delete your experiment data.
I somehow missed this in the user manual. This works as intended, thanks!

12 People are following this question.