question

Jesús Evangelista avatar image
0 Likes"
Jesús Evangelista asked Jesús Evangelista commented

Need to get a state chart or state percentaje of each location.

Hello!

In a model I'm developing I used some locations (Kiosks) to simulate time checkers. The logic was developed in Process Flow.

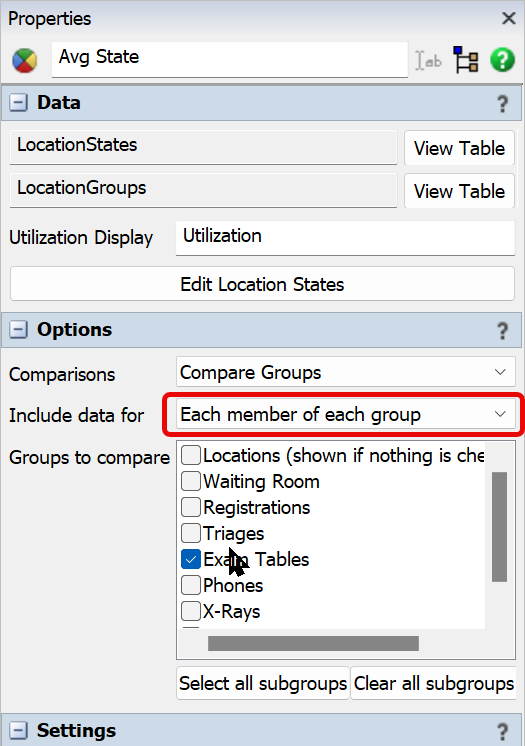
Now I need to get the utilization of EACH Kiosk in a Dashboard. A state chart, such as the normal ones, would be perfect. I tried to add the chart, using the Healthcare environment (using the location state chart list), and it worked, but shows the states of ALL locations.
Is there an easy way to get what I need? Getting the percetaje state of each location.
Thank you in advice! :)

FlexSim 24.2.0
chartsutilizationlocationshealtcharelocation states
5 |100000

Up to 12 attachments (including images) can be used with a maximum of 23.8 MiB each and 47.7 MiB total.

1 Answer

Regan Blackett avatar image
1 Like"
Regan Blackett answered Jesús Evangelista commented

Hi @Jesús Evangelista. I think you should be able to get what you are looking for by selecting "Each member of each group" from the "Incluide data for" menu in the dashboard properties.

Like this:


1725061651212.png


Just make sure your Kiosks in a Group.


1725061651212.png (44.1 KiB)
· 1
5 |100000

Up to 12 attachments (including images) can be used with a maximum of 23.8 MiB each and 47.7 MiB total.

Jesús Evangelista avatar image Jesús Evangelista commented ·
It worked perfectly. Thank you!
0 Likes 0 ·