question

Sohee P avatar image
0 Likes"
Sohee P asked Matthew Gillespie commented

How do I get min, max, avg Queue contents using Dashboard in version 2022?

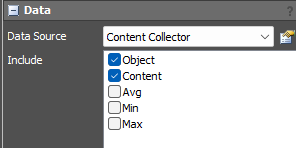
When I used FlexSim version 2020, It is easy to get Queue Min, Max, Avg Contents in Dashboard using Statistic Pin icon. But After I use version 2022, I don't know how get Min, Max, Avg Queue contents in Dashboard.

How do I get Min, Max, Avg Queue Contents in Dashboard using Pin or other function?

FlexSim 22.0.16
dashboardsqueue contentmax contentmin content
· 2
5 |100000

Up to 12 attachments (including images) can be used with a maximum of 23.8 MiB each and 47.7 MiB total.

Julie Weller avatar image Julie Weller commented ·

Hi @Sohee P, was one of Jason Lightfoot's or Joerg Vogel's answers helpful? If so, please click the "Accept" button at the bottom of the one that best answers your question. Or if you still have questions, add a comment and we'll continue the conversation.

If we haven't heard back from you within 3 business days we'll auto-accept an answer, but you can always comment back to reopen your question.

0 Likes 0 ·
Matthew Gillespie avatar image Matthew Gillespie ♦♦ commented ·

@Sohee P These have been added to the Content chart in FlexSim 2024. The 2024 Beta is now available for download.

0 Likes 0 ·
Jason Lightfoot avatar image
1 Like"
Jason Lightfoot answered

Install the chart and open the Stats collector it creates (probably called Content Collector).

Then add columns for min, max, avg with the following fields values:

data.rowValue.as(Object).stats.content.minimum

data.rowValue.as(Object).stats.content.maximum

data.rowValue.as(Object).stats.content.average

Then in the chart properies, check the the columns

1686227717572.png


1686227717572.png (5.1 KiB)
5 |100000

Up to 12 attachments (including images) can be used with a maximum of 23.8 MiB each and 47.7 MiB total.

Joerg Vogel avatar image
0 Likes"
Joerg Vogel answered Sohee P commented

I guess currently: By red pin AND shown as table? Maybe you have to undock the window first by diagonal arrow in Headline of statistics pane first?

· 1
5 |100000

Up to 12 attachments (including images) can be used with a maximum of 23.8 MiB each and 47.7 MiB total.

Sohee P avatar image Sohee P commented ·

I already did it. I just want to show Queue Min, Max, Avg Table in Dashboard.

0 Likes 0 ·

Write an Answer

Hint: Notify or tag a user in this post by typing @username.

Up to 12 attachments (including images) can be used with a maximum of 23.8 MiB each and 47.7 MiB total.