how can i get the summation of values in the top graphs to be displayed in the bottom ones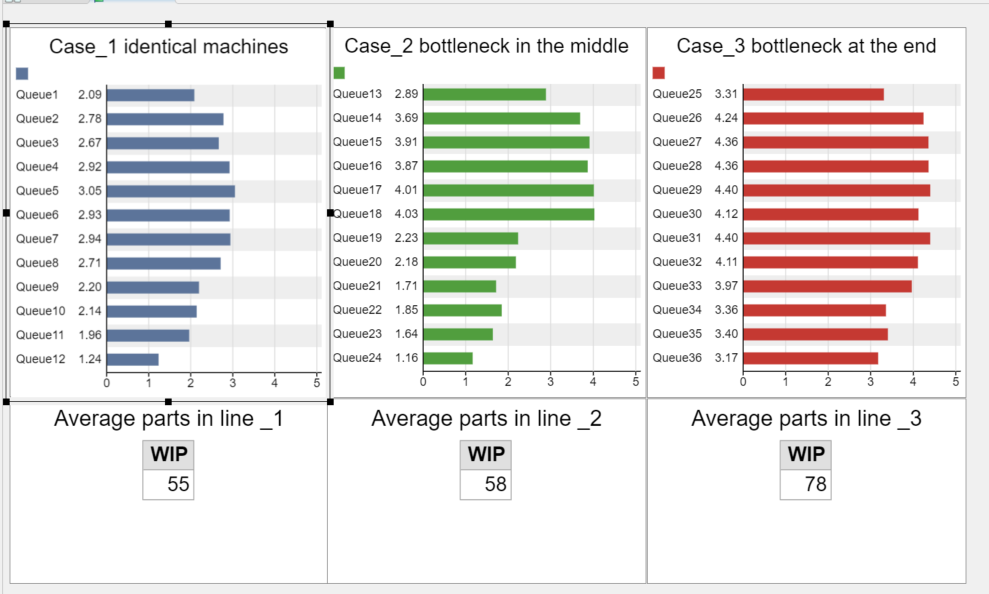
in the top ones i used "average content" dashboard i want to sum all the values and name it "average inventory on line_1
bottleneck analysis.fsm
how can i get the summation of values in the top graphs to be displayed in the bottom ones
in the top ones i used "average content" dashboard i want to sum all the values and name it "average inventory on line_1
bottleneck analysis.fsm
You create a Statistics Collector that gathers that information and use it as the data source in a general table chart.
Apart from the documentation, a good way to learn how Statistics Collectors can be set up is to install the components (through the "Advanced" tab in the chart's properties) of premade charts (such as the Average Content chart you are using) and look at how they work.
In this case, all you need is a reset event that creates a single row. In the "Columns" tab, set the update timing to "When row is accessed". And in the value field, sum up the average content statistic of all relevant queues (a group can make this much easier). Again, you can learn the necessary code from the Statistics Collector of the Average Content graph. (It has two columns but the second one has no name, so it is not immediately apparent when looking at the columns tab.)
17 People are following this question.
© 1993- FlexSim Software Products, Inc. All Rights Reserved.
FlexSim is a fully 3D simulation software environment. FlexSim can be used to simulate any process in any industry.
FlexSim®, FlexSim Healthcare™, Problem Solved.®, the FlexSim logo, the FlexSim X-mark, and the FlexSim Healthcare logo with stylized Caduceus mark are trademarks of FlexSim Software Products, Inc. All rights reserved.
