question

Felipe Capalbo avatar image
0 Likes"
Felipe Capalbo asked Felipe Capalbo commented

Problem with Dashboard referencing Zone

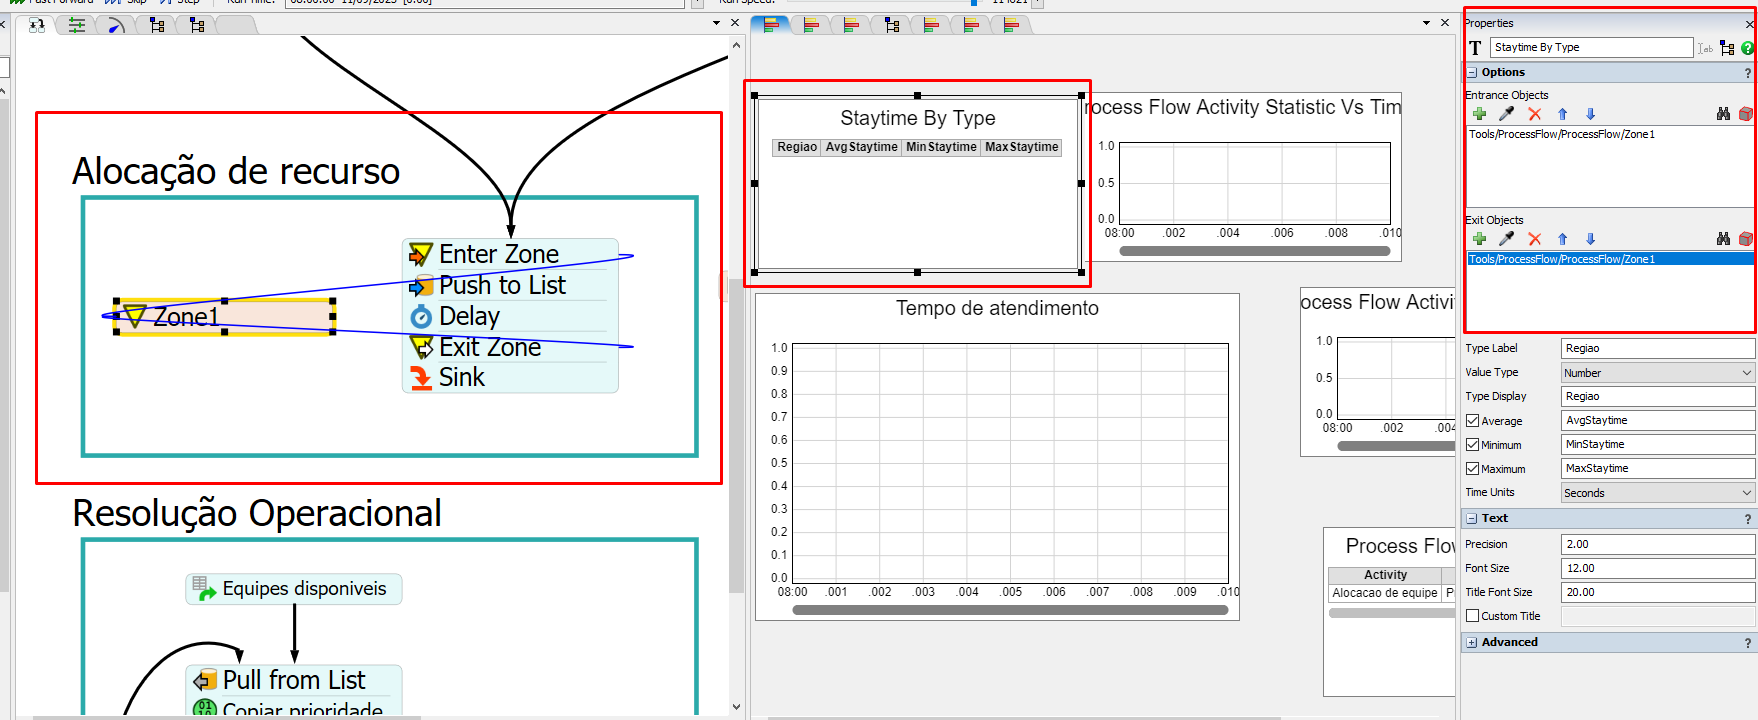
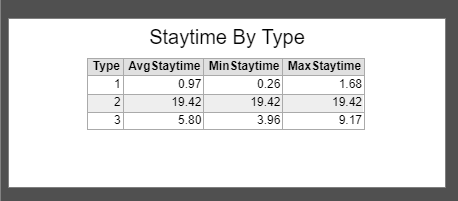
When creating a table dashboard and referencing a Zone, the dashboard data don't show up. But when referencing the Enter Zone activity, at the Entrance field, and the Exit Zone activity, at the Exit field, the dashboard works as normal.Modelo_Tarefa2.fsm

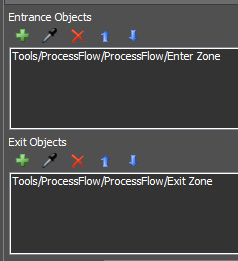
Table Dashboard when referencing Zone activity:
microsoftteams-image-1.png

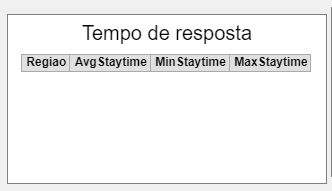
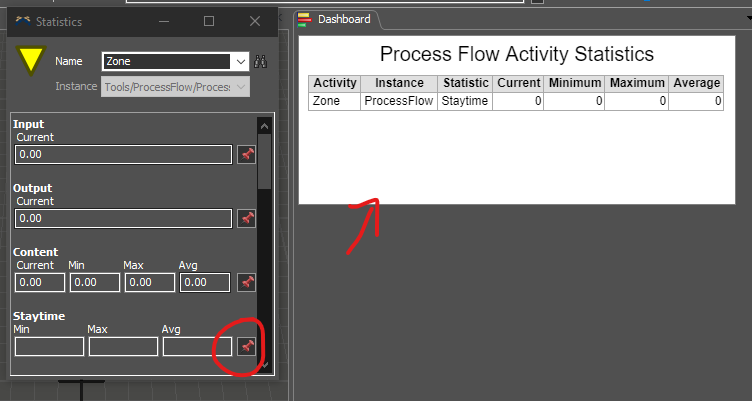
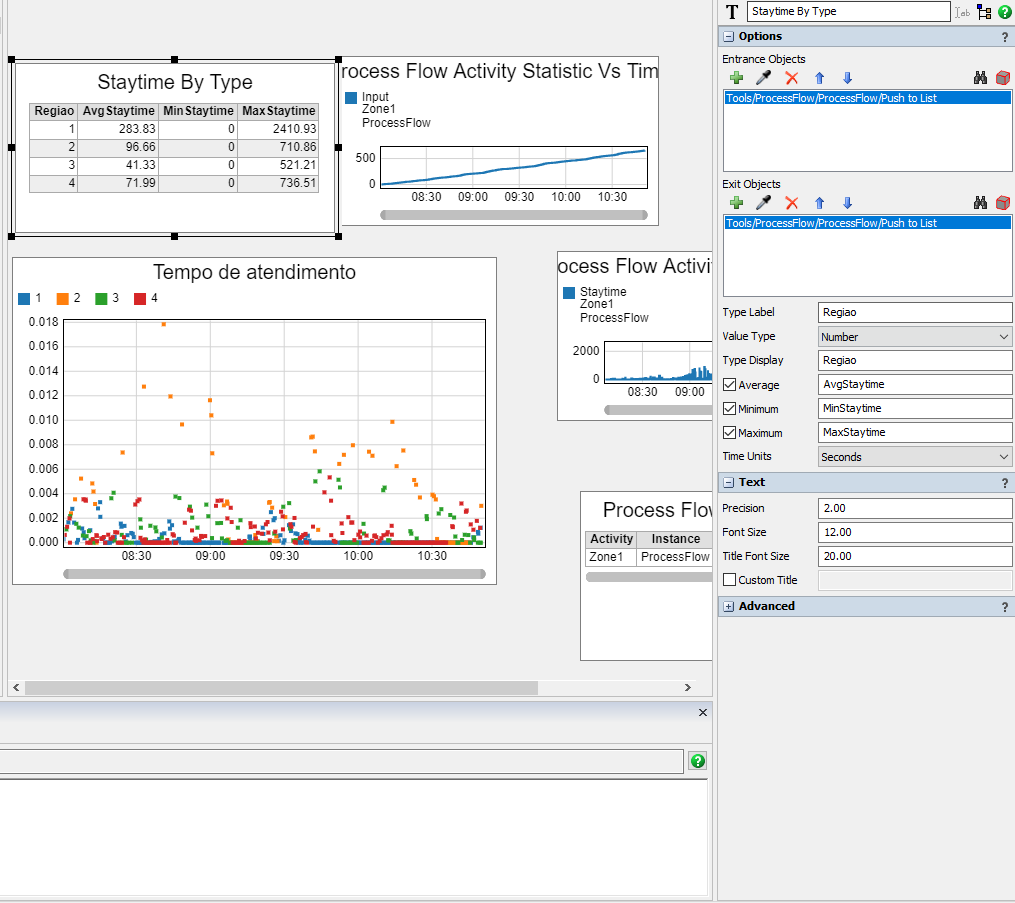
ProcessFlow and Dashboard view:

microsoftteams-image-2.png

FlexSim 23.2.1
zone
5 |100000

Up to 12 attachments (including images) can be used with a maximum of 23.8 MiB each and 47.7 MiB total.

1 Answer

·
Kavika F avatar image
0 Likes"
Kavika F answered Felipe Capalbo commented

Hey @Felipe Capalbo, it looks like you're using a Staytime chart from the dashboard menu.

1694803972983.png

If you want statistics for a Process Flow activity or resource, you should go to the statistics button on that activity or resource.

1694804025517.png

That will pop up a window with statistics for that activity. The zone happens to have a Staytime statistic you can pin to a dashboard with a different looking table with the stats you may be looking for.

1694804090086.png

pf-stats.fsm


1694803972983.png (6.7 KiB)
1694804025517.png (13.4 KiB)
1694804090086.png (32.2 KiB)
pf-stats.fsm (48.0 KiB)
· 3
5 |100000

Up to 12 attachments (including images) can be used with a maximum of 23.8 MiB each and 47.7 MiB total.

Felipe Capalbo avatar image Felipe Capalbo commented ·

In this case, the Dashboard data would have to be separated by each Zone Subset, not presented in an aggregated form. Each line of the Table Dashboard would be a different Subset from the Zone.

For example:
microsoftteams-image-3.png

In this case, the Dashboard is referencering the Push to list activity, not the Zone, where the problem is sited by.

0 Likes 0 ·
Kavika F avatar image Kavika F ♦ Felipe Capalbo commented ·

@Felipe Capalbo, what is your question? From what I can see in your post, you were expecting to be able to use the Zone activity to fill in a chart that requires an Entrance and Exit object to function:

1694808867517.png

Which you figure out and get working on your own:

1694808897733.png

The chart expects certain inputs which the Zone alone cannot satisfy because it is a Shared Asset - tokens do not flow through those. So for a chart to have "Entrance Objects" and "Exit Objects" it is expecting you to supply objects (either 3D Objects or Activities) in which items flow through.

1 Like 1 ·
1694808867517.png (8.3 KiB)
1694808897733.png (8.4 KiB)
Felipe Capalbo avatar image Felipe Capalbo Kavika F ♦ commented ·

I was trying to figure out why referencing only the Zone wasn't allowing me to display the Dashboard, because on previous FlexSim versions it worked as normal. But that solution of referencing the Enter Zone and the Exit Zone works as well. Thank you!

1 Like 1 ·

Write an Answer

Hint: Notify or tag a user in this post by typing @username.

Up to 12 attachments (including images) can be used with a maximum of 23.8 MiB each and 47.7 MiB total.