question

JP117 avatar image
0 Likes"
JP117 asked Jason Lightfoot commented

Dashboard with Object Process Flow

Why can't the dashboard capture statistics on an Object process flow

FlexSim 23.2.1
dashboards
· 3
5 |100000

Up to 12 attachments (including images) can be used with a maximum of 23.8 MiB each and 47.7 MiB total.

Joerg Vogel avatar image Joerg Vogel commented ·

@JP117,I don't understand what you want get data from, because in attached example I can get a chart of waiting tokens of an activity in process flow. dashboard_for_process_flow_activity.fsm

Maybe you can attach an example yourself and you describe a bit deeper what your problem is?

0 Likes 0 ·
JP117 avatar image JP117 commented ·

I just want to capture the number of tokens that go through. the delay process. On the general process flow I was always able to point the eye dropper to the delay. Object process flows are new to me1700233891252.png

0 Likes 0 ·
1700233891252.png (148.3 KiB)
Jason Lightfoot avatar image Jason Lightfoot ♦ commented ·

Hi @JP117, was Jason Lightfoot's answer helpful? If so, please click the "Accept" button at the bottom of their answer. Or if you still have questions, add a comment and we'll continue the conversation.

If we haven't heard back from you within 3 business days we'll auto-accept an answer, but you can always comment back to reopen your question.

0 Likes 0 ·

1 Answer

·
Jason Lightfoot avatar image
0 Likes"
Jason Lightfoot answered

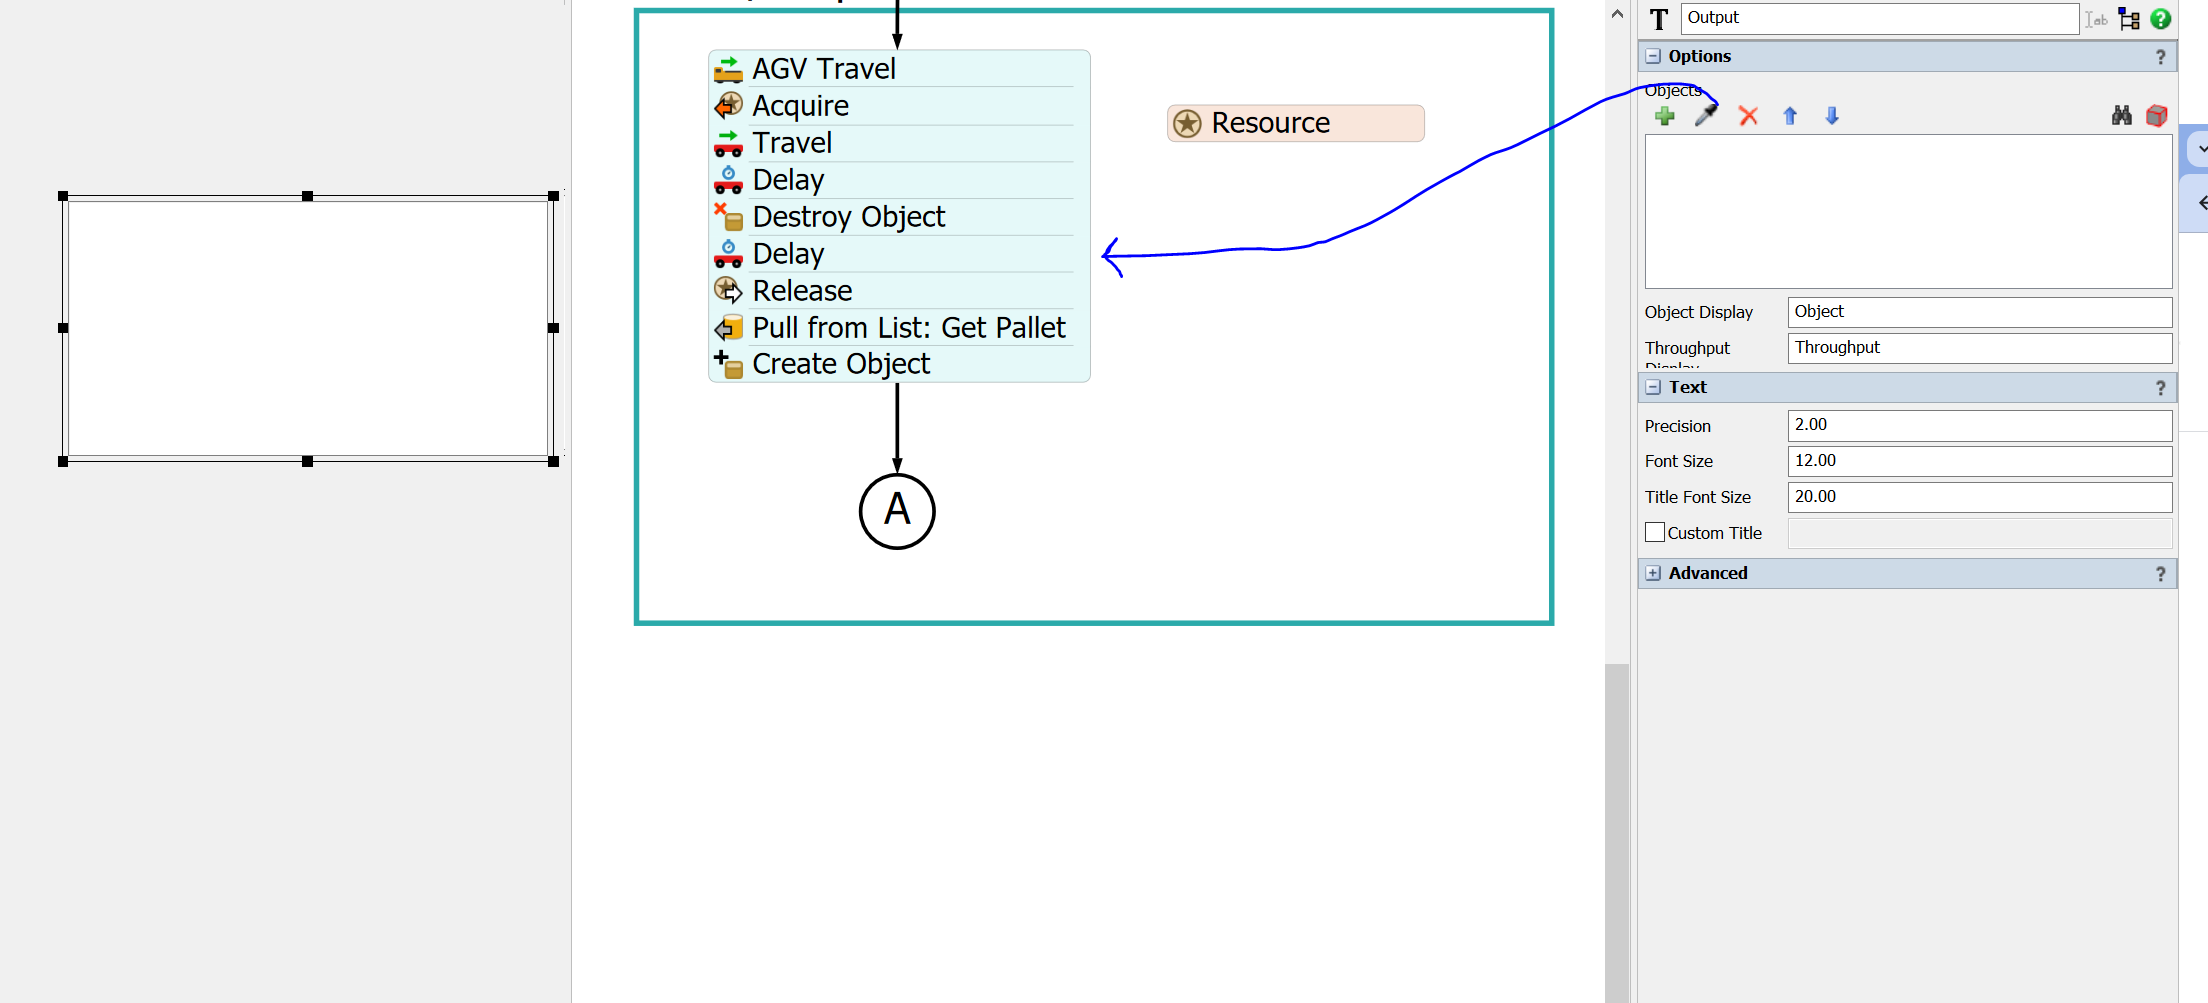
Try right clicking the delay and choose 'Explore as tree'. Then sample the tree object.

5 |100000

Up to 12 attachments (including images) can be used with a maximum of 23.8 MiB each and 47.7 MiB total.

Write an Answer

Hint: Notify or tag a user in this post by typing @username.

Up to 12 attachments (including images) can be used with a maximum of 23.8 MiB each and 47.7 MiB total.