question

Ana Madureira avatar image
0 Likes"
Ana Madureira asked Ana Madureira commented

Change the Tracked Variables in a Dashboard between Experimenter Scenarios

Hello! How is everyone? I have a doubt regarding the use of dashboards and Experimenter.

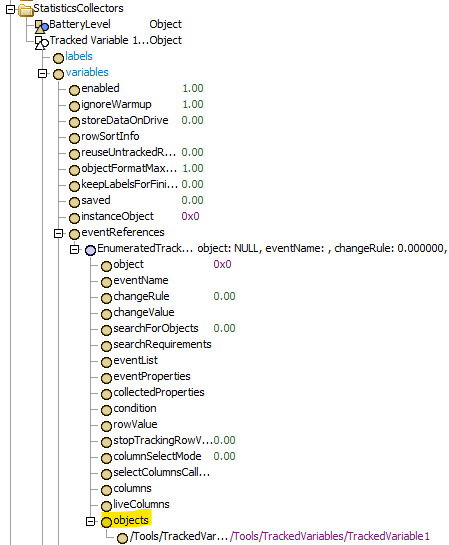
I want to experiment different number of AGV's using as a KPI "Battery Level", registered in a Tracked Variable (image bellow with 6 AGV's, for example).

imagem-2024-01-22-152522587.png

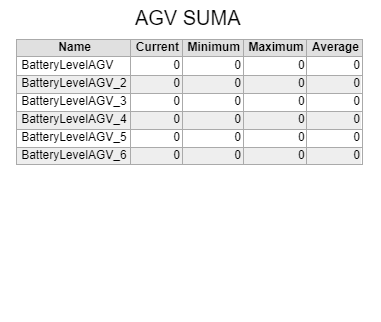
I want to experiment with 5 and 6 AGV's, but, between the scenario with 5 and the scenario with 6 AGV's, I have to manually change the dashboard to include the Tracked Variable related to AGV_6.

My question is: Is there a way to experiment the two scenarios without having to pause and manually change the dashboard? That way I could run both scenarios consecutively without compromising the average (calculated using the tool Performance Measure).


Thank you in advance for your help! :)

FlexSim 23.2.1
agvdashboardsexperiment
5 |100000

Up to 12 attachments (including images) can be used with a maximum of 23.8 MiB each and 47.7 MiB total.

1 Answer

·
Felix Möhlmann avatar image
0 Likes"
Felix Möhlmann answered Ana Madureira commented

You can run code to add/remove subnodes from the "objects" node in the Statistics Collectors tree. (You have to install the components of the charts first to see and access the collector).

capture1.png

You could also build a custom Statistics Collector that only creates as many rows as mandated by the parameters. In the attached model I read the default battery level of the AGVs that way.

Note: In order to be able to access the "batteryLevel" TR-node of the AGV class, you first have to initialize it by adding a listener to the "On AGV Battery Level Change" event, for example in an Event Triggered Source in Process Flow. You can remove that activity again afterwards.

battery-level-tr-collector-fm.fsm


· 1
5 |100000

Up to 12 attachments (including images) can be used with a maximum of 23.8 MiB each and 47.7 MiB total.

Ana Madureira avatar image Ana Madureira commented ·
Hello! Thank you so much. I tried building the Statistics Collector after instaling the components of the chart. but could figure out how to make it work. I'll see the model you sent and I'll report my progress.


Thank you again for your help!

0 Likes 0 ·

Write an Answer

Hint: Notify or tag a user in this post by typing @username.

Up to 12 attachments (including images) can be used with a maximum of 23.8 MiB each and 47.7 MiB total.