question

Bruno T2 avatar image
1 Like"
Bruno T2 asked Phil BoBo commented

Output per hour

Hello,

i'm currently using FlexSim for the first time and i'm trying some simples exemples to figure out what can I obtain from Flexsim but I am already struggle to obtain very basics stuff from the sumilation.

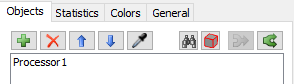
I'm running a little system composed by a source, a queue, a processor, a sink and some conveyors to connect it all.

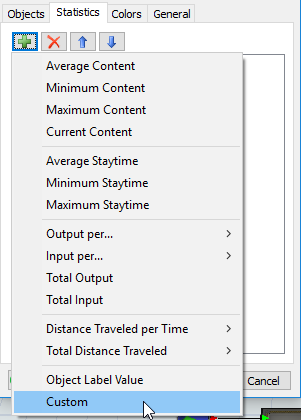
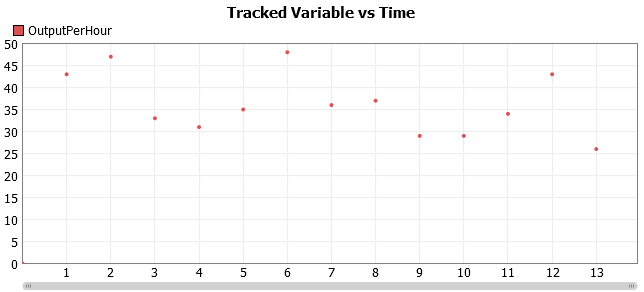
Basically what i'm trying to get is the output per hour from the processor to the sink BUT unfortunattly after few hours of tries, i'm not getting the expected result.

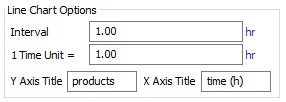
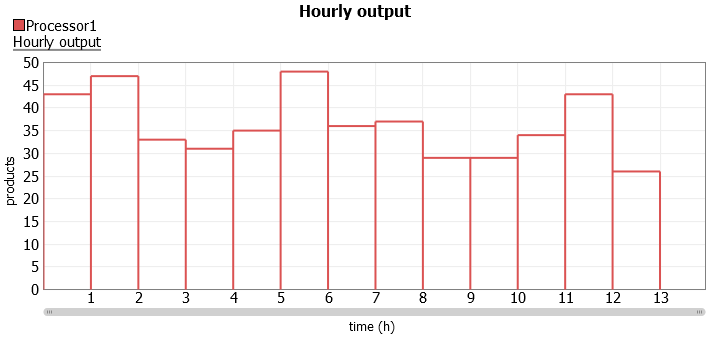
I am aiming to get a chart (time chart or bar chart) which show me for every hour of the day, how many boxes are outgoing from the processor but what i'm getting is always the cumulation per hour (since the begening to the current hour) of all outgoesed boxes.

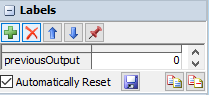
I already tried to check "Discard old data" with a keep newest value at 3600 seconds but it doesn't seem to affect the result produced.

I'm sure there is an easy way to get what i'm looking for so, anyone can help me ?

FlexSim 17.1.2
output per hour
5 |100000

Up to 12 attachments (including images) can be used with a maximum of 23.8 MiB each and 47.7 MiB total.

1 Answer

·
Clair A avatar image
3 Likes"
Clair A answered Phil BoBo commented

Hello Bruno,

Attached I've built a model similar to the one proposed by @phil.bobo, with an alternative solution for the graph.

On the processor, create a label called previousOutput, and check Automatically Reset.

In the dashboard, drag & drop a Content vs Time graph. Change the graph name as you like. Then add the Processor in the Objects tab:

In the Statistics tab, remove the Current Content statistic and add a Custom one:

And copy paste this code:

Object resource = i;
int value = resource.stats.output.value - resource.previousOutput?;
resource.previousOutput = resource.stats.output.value;

if(time > 0){
	treenode graph = ownerobject(c);
	treenode timedata = getvarnode(graph, "timedata");
	double timeinterval = getvarnum(graph, "timeinterval");
	addbundleentry(timedata, time - timeinterval, value);
	addbundleentry(timedata, time, value);
}
In the General tab, change the interval to 1 hour and the time units also to 1 hour.

With this method you get a graph with stair steps for each hour:


1.png (5.4 KiB)
2.png (5.6 KiB)
1.png (5.4 KiB)
3.png (12.7 KiB)
4.png (2.9 KiB)
5.png (11.1 KiB)
· 3
5 |100000

Up to 12 attachments (including images) can be used with a maximum of 23.8 MiB each and 47.7 MiB total.

Phil BoBo avatar image Phil BoBo ♦♦ commented ·

Attached is an example model that uses a Tracked Variable and a repeating User Event to log the system's output each hour.

The tracked variable is then charted using a Tracked Variable vs Time chart on the dashboard:

0 Likes 0 ·
Bruno T2 avatar image Bruno T2 commented ·

Hello,

I'm really thanksfull for your answers ! @Clair A I followed your exemple step by step and I get exactly what I was looking for ! That's great.

Unfortunattly I just "copy past" the code and i'm not able to understand it, so hopefully it will always works, for every thoughput per hour I will look for, because in others cases I will not be able to make any modification... /:

@phil.bobo Thank you for your exemple ! I'm trying to understand it to use it, but I don't even know how to creat a Tracked variable...

I had check the user manual and it is said that you have to go to : the view->toolbox->Tracked Variables but I don't see anything concerning tracked variables in the toolbox in my exemple or in your exemple file neither.

I thing it should take a lot of time to do it but if you can guide me a little bit more to make all steps from the beginning, it would be great !

0 Likes 0 ·
Clair A avatar image Clair A Bruno T2 commented ·

You're right, writing code is not the easiest solution especially when you are a beginner. I've sent a suggestion to the development team to add a similar feature to graphs hoping it will be included in a future release.

Regarding Tracked Variables and User Events, actually you don't have access to all tools in the free Express version of FlexSim:

But with a license:

User Events are in the Modeling Logic section:

I will ask my colleagues to create a timed license for you so that you will be able to go deeper in your evaluation.

0 Likes 0 ·
1.png (26.1 KiB)
2.png (27.9 KiB)
3.png (7.5 KiB)

Write an Answer

Hint: Notify or tag a user in this post by typing @username.

Up to 12 attachments (including images) can be used with a maximum of 23.8 MiB each and 47.7 MiB total.