question

wei-ting L avatar image
0 Likes"
wei-ting L asked Joshua S commented

Pie State vs Time in an excel table.

Is there a way to export the state pie to an excel and analyze it?

I want the pie status's information every day.

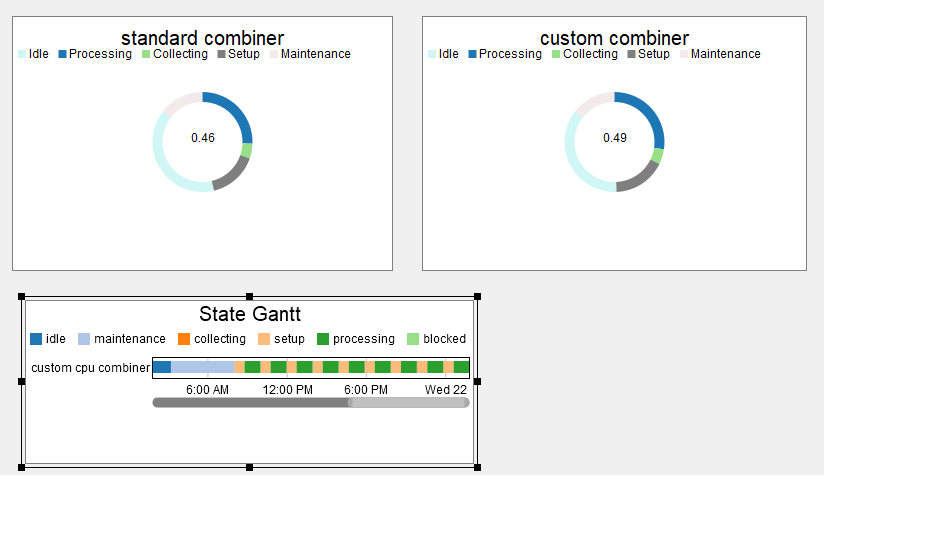
My dashboard is showing the "current" state of my machine's status. But I want the entire duration's information. From simulated day 1 to simulated day 31. In an excel table, showing that day 1's utilization rate is 20%, the idle rate is 80%. Days 2's utilization rate is 40%...... So the table should have many rows, each row represents one day. And the columns will show the status' of my machine.

Is there a way to do that?

FlexSim 18.2.2
state piepie
state.png (14.5 KiB)
5 |100000

Up to 12 attachments (including images) can be used with a maximum of 23.8 MiB each and 47.7 MiB total.

1 Answer

·
Sam Stubbs avatar image
0 Likes"
Sam Stubbs answered Joshua S commented

Yes you can export the table data of a chart into a CSV format that can be read by Excel.

If you're using one of the templates, you can open the chart's properties, open up the Advanced tab, and click on the Export Data button.

If you're using your own custom Statistic Collector for the chart you can select the General Tab in the Stats Collector's property window, and select the button Export Table from there.

· 6
5 |100000

Up to 12 attachments (including images) can be used with a maximum of 23.8 MiB each and 47.7 MiB total.

wei-ting L avatar image wei-ting L commented ·

Yes I know I can export the data by selecting chart's properties. But the problem is that it only shows the current model time's statues. It does not show the status vs time. So I don't know the changes of statues over time.

0 Likes 0 ·
Joshua S avatar image Joshua S wei-ting L commented ·

Do you want the stats to be accumulating, or reset every day?

0 Likes 0 ·
wei-ting L avatar image wei-ting L Joshua S commented ·

Accumulating everyday.

So it should be something similar to this:

And the model records the status everyday.

0 Likes 0 ·
Show more comments
wei-ting L avatar image wei-ting L commented ·

Hi Joshua,

The model you attached does not show each day's utilization/idle rate.

Do you know how should I set up the model?

0 Likes 0 ·
Joshua S avatar image Joshua S wei-ting L commented ·

@wei-ting L

Take a look at this model, everything is being calculated in StatisticsCollector1, so after so many days you can stop the model, right click the StatisticsCollector1, and export it as an excel file.

exportdaily-1.fsm

0 Likes 0 ·
exportdaily-1.fsm (32.4 KiB)

Write an Answer

Hint: Notify or tag a user in this post by typing @username.

Up to 12 attachments (including images) can be used with a maximum of 23.8 MiB each and 47.7 MiB total.