question

Shinya O avatar image
0 Likes"
Shinya O asked Julie Weller commented

Dashboard using Statistic Pin icon

Hi,

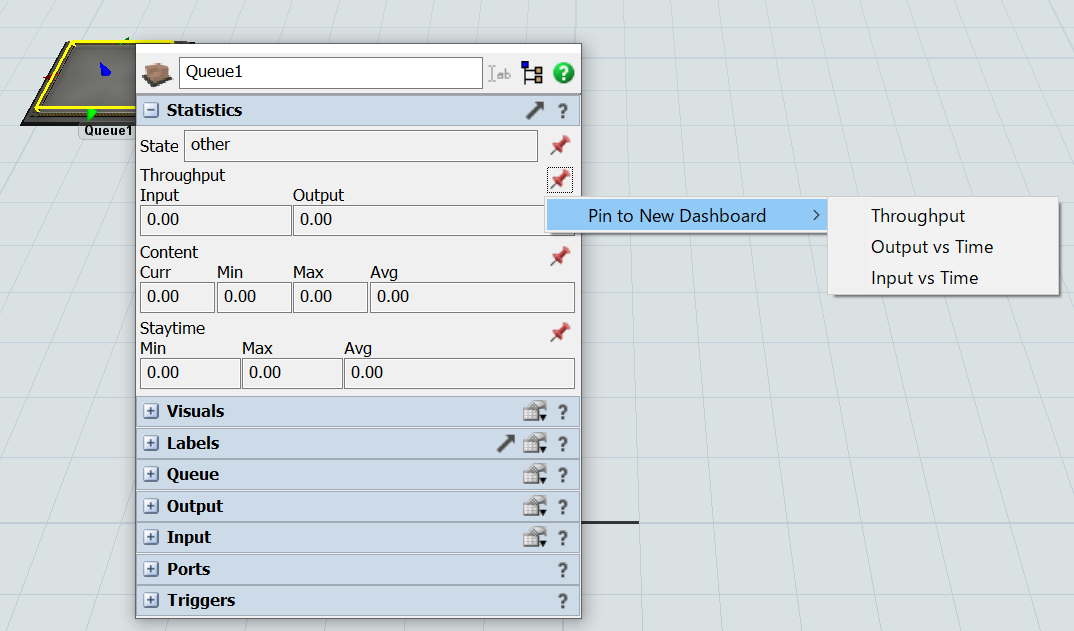
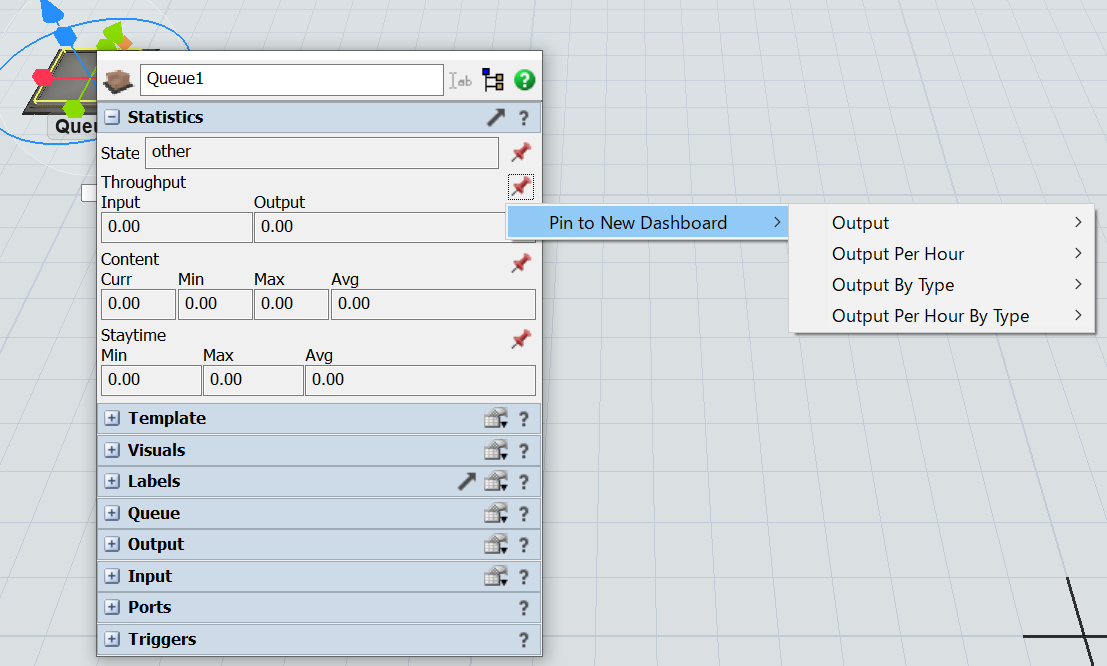
It is easy to get Input vs Time in Dashboard using Statistic Pin icon in FlexSim 2021, but there is no easy way to get Input vs Time in FlexSim 2022 or 2023.

Is there an easy way without using the stats collector?
Will this menu be revived in future version upgrades?
The reason I am asking this question is that many users are not familiar with the stats collector.

The same situation is happening with Min, Max, Avg contents.

Related questions are:

https://answers.flexsim.com/questions/117389/pinning-input-versus-time-data-for-sink-to-dashboa.html

https://answers.flexsim.com/questions/143559/how-do-i-get-min-max-avg-queue-contents-using-dash.html

Thanks in advance.

1687417889275.png


1687418092942.png

FlexSim 23.0.0
dashboardsinput vs timemin max avg
1687417889275.png (71.0 KiB)
1687418092942.png (77.5 KiB)
· 1
5 |100000

Up to 12 attachments (including images) can be used with a maximum of 23.8 MiB each and 47.7 MiB total.

Julie Weller avatar image Julie Weller commented ·

Hi @Shinya O, was Jordan Johnson's answer helpful? If so, please click the "Accept" button at the bottom of their answer. Or if you still have questions, add a comment and we'll continue the conversation.

If we haven't heard back from you within 3 business days we'll auto-accept an answer, but you can always comment back to reopen your question.

0 Likes 0 ·

1 Answer

·
Jordan Johnson avatar image
0 Likes"
Jordan Johnson answered

The Output per Hour -> Line Chart option in the pin button works with the Sink, and correctly displays the Input value, even though the chart title says "Output". Note that this chart only shows data once per hour by default, so you'll need to change the interval on the chart or run the model for a while to see data.

In version 2022, we updated the pin buttons so that they create charts that are also found in the Dashboard Library. This brings the pin button and dashboard into alignment. However, not every chart available in the pin buttons was found in the dashboard library, and Input vs Time was one of those.

5 |100000

Up to 12 attachments (including images) can be used with a maximum of 23.8 MiB each and 47.7 MiB total.

Write an Answer

Hint: Notify or tag a user in this post by typing @username.

Up to 12 attachments (including images) can be used with a maximum of 23.8 MiB each and 47.7 MiB total.