question

Joseph Ai avatar image
0 Likes"
Joseph Ai asked Ryan Clark commented

Pinning Input versus Time data for sink to dashboard

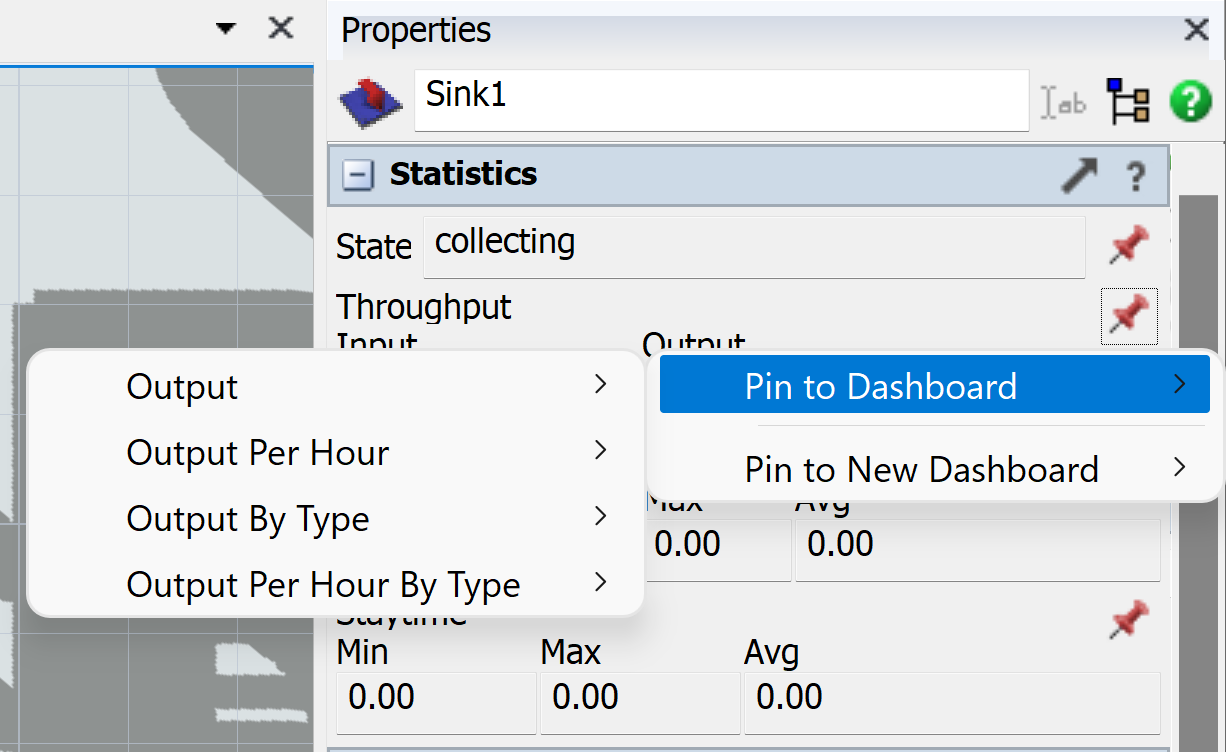
I need to get the input vs time data for this sink, but the option will not show up when I choose to pin a throughput to a dashboard. How can I get that?

P.S. I was able to get input vs time in 2021 version but I've been using 2022 and I cannot figure out how to do it

1647877549991.png

FlexSim 22.1.0
dashboard data
1647877549991.png (90.2 KiB)
· 2
5 |100000

Up to 12 attachments (including images) can be used with a maximum of 23.8 MiB each and 47.7 MiB total.

Joerg Vogel avatar image Joerg Vogel commented ·
Your picture shows an output. A sink has none output! Perhaps you try it with an input.
1 Like 1 ·
Ryan Clark avatar image Ryan Clark commented ·

Hi @Joseph Ai, was Felix Möhlmann's answer helpful? If so, please click the "Accept" button at the bottom of their answer. Or if you still have questions, add a comment and we'll continue the conversation.

If we haven't heard back from you within 3 business days we'll auto-accept an answer, but you can always unaccept and comment back to reopen your question.

0 Likes 0 ·

1 Answer

·
Felix Möhlmann avatar image
1 Like"
Felix Möhlmann answered

I don't know if this was intentional or an oversight when changing all pinned statistics to use the same mechanics in the last version.

It's not too difficult to create your own statistics collector for this task though. In the attached model I listen to the OnEntry event of the sink to add a new row to the statistics collector table every time an item enters the sink. I also have a timer event set up so the graph updates regularly even if the value doesn't change. To have a reference to the sink for the timer event, I added it as a label to the collector.

InputVsTimeCollector.fsm

All needed information should be available in the statistics collector tutorial, but here is a short summary of the needed steps:

A statistics collector adds data to an internal table (you can view this table under the "General" tab). Each row of the table can represent one of more data points in a connected chart. For a time chart, each row needs to hold the time and the corresponding value.

In the Events tab, you set up which events should trigger the creation (or update) of a data row. In this case this should be an event that marks a change in the input of the sink (OnEntry, OnInputChange). Since each event should add a new row you can ignore the "Row Value" setting of the statistics collector.

1647937155626.png

The data that gets written to the table is determined in the "Columns" tab. Here we need two columns, as mentioned before; time and value/input. The time can gotten from the command "Model.time" (model time in seconds) or "Model.dateTime" (date/time format). Make sure to use the correct "Display Format" depending on which command you choose to use.

If you use the "OnInputChange" event, the input value is part of the parameter set of that event and is automatically available through "data.NewValue" (if you didn't change the label name in the Events tab; the 2021 version uses "data.Input" for example). For the timer event in the attached model a reference to the sink is needed. You could use "Model.find()" to get it, but I opted to add it as a pointer label to the collector itself. Through "object.stats.input.value" the input statistics of an object can be read.

1647937174410.pngAfter setting up the statistics collector, you can add a base chart to the dashboard and connect it to the collector by choosing it as the data source. Then make sure that the x- and y-values and other settings are correct.

1647937261078.png

https://docs.flexsim.com/en/22.1/Tutorials/AdditionalTools/Tutorial2StatsCollector/2-2StationOutputCollector/2-2StationOutputCollector.html

You could also load up the 2021 version and have a look at how it is done there. Pinning the input vs. time to dashboard also simply adds a statistics collector and a line chart that is linked to it to the model. That collector uses the OnInputChange event to update it's table.

1647936402529.png


1647936402529.png (44.9 KiB)
1647937155626.png (38.5 KiB)
1647937174410.png (33.8 KiB)
1647937261078.png (30.8 KiB)
5 |100000

Up to 12 attachments (including images) can be used with a maximum of 23.8 MiB each and 47.7 MiB total.

Write an Answer

Hint: Notify or tag a user in this post by typing @username.

Up to 12 attachments (including images) can be used with a maximum of 23.8 MiB each and 47.7 MiB total.