Hi all,
In the model attached, the first data point on the throughput vs time graph appears as negative after the warmup period. Why would this be the case? I don't want the negative number to be showing in the time graph.
Thanks,
Hi all,
In the model attached, the first data point on the throughput vs time graph appears as negative after the warmup period. Why would this be the case? I don't want the negative number to be showing in the time graph.
Thanks,
Here are some steps that will remove the negative values after warmup. I'll ask one of the developers here to look at this as well to check and see if it is something that should be changed in future releases. @jordan.johnson
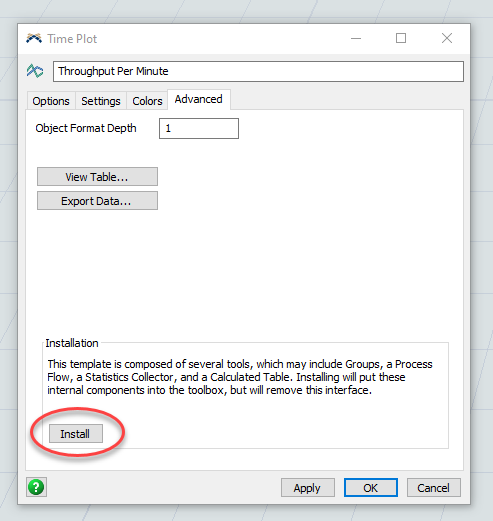
1) Install the process flow of the graph by clicking on the "Install" button circled in red in the picture.
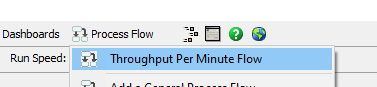
2) Open the newly installed process flow
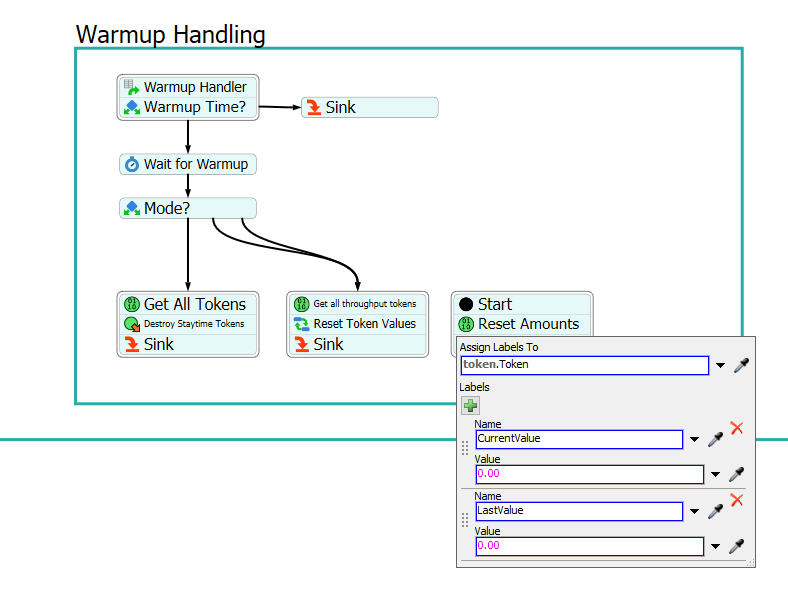
3) Change the Label names in the "Reset Amounts" activity to the ones shown in the picture below.
This works in 19.1 and in the latest version of the software.
I hope this gets you what you wanted,
Brandon
14 People are following this question.
FlexSim can help you understand and improve any system or process. Transform your existing data into accurate predictions.
FlexSim is a fully 3D simulation software environment. FlexSim can be used to simulate any process in any industry.
FlexSim®, FlexSim Healthcare™, Problem Solved.®, the FlexSim logo, the FlexSim X-mark, and the FlexSim Healthcare logo with stylized Caduceus mark are trademarks of FlexSim Software Products, Inc. All rights reserved.
May we collect and use your data?
Learn more about the Third Party Services we use and our Privacy Statement.May we collect and use your data to tailor your experience?
Explore the benefits of a customized experience by managing your privacy settings for this site or visit our Privacy Statement to learn more about your options.