question

Jingyong P avatar image
0 Likes"
Jingyong P asked Jordan Johnson commented

Token Exit Interval time for Statistic and dashboard purpose

Hello,

@Jordan Johnson

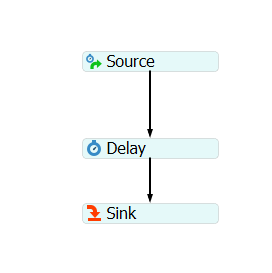
This is a simplified model. I could not figure out how to get tokens exit interval time. for example:

Token 1 exit time: 12.5

Token 2 exit time: 16.4

Token 3 exit time: 21.9

so 1st interval time between 1 and 2 is: 16.4-12.5= 3.9

2nd interval time between 2 and 3 is: 21.9-16.4=5.5

Eventually, I want to project 3.9, 5.5 .... on a dashboard chart. Basically, get process takt time data.

Thank you very much.Interval of Token Exit Time.fsm

FlexSim 21.0.2
flexsim 21.0.2time interval
5 |100000

Up to 12 attachments (including images) can be used with a maximum of 23.8 MiB each and 47.7 MiB total.

1 Answer

·
Jordan Johnson avatar image
0 Likes"
Jordan Johnson answered Jordan Johnson commented

Great question! We don't have any pre-built charts that show this time, so you'll need to make a custom Statistics Collector. Here's an updated model:

interval-of-token-exit-time-modified.fsm

The basic idea is to listen to the On Entry of the Sink in the stats collector. Every time a token enters the sink, you want to do two things:

  • Record the time since the previous token, and
  • Remember the current time, so can calculate the difference on the next token

In order to do both these things, I listen to the same event twice. This means the stats collector will respond to the same event twice. The first time, the stats collector checks to see if there is an active row. If there is, the stats collector records the time since that row was made, and then finishes the row. The second time, the stats collector starts a new row.

Also note the triggers. When I add a row, I also record the time the row was added on a row label. Then, when I finish the row, I can look up that row label and calculate the duration.

Once that was done, all that was left was to make a chart. I added a box plot from the Base Chart Types section. These charts assume you have already made a stats collector or a calculated table. Then I just pointed the chart at the stats collector I made.


· 2
5 |100000

Up to 12 attachments (including images) can be used with a maximum of 23.8 MiB each and 47.7 MiB total.

Jingyong P avatar image Jingyong P commented ·

@Jordan Johnson, Thank you so very much. It totally works in my real model. Thank you.

Do you think Flexsim can add this to future update?

0 Likes 0 ·
Jordan Johnson avatar image Jordan Johnson ♦♦ Jingyong P commented ·

I'll add it to the dev list. I'm glad it worked for you!

1 Like 1 ·

Write an Answer

Hint: Notify or tag a user in this post by typing @username.

Up to 12 attachments (including images) can be used with a maximum of 23.8 MiB each and 47.7 MiB total.