Idea

Serge A avatar image
2 Likes"
Serge A suggested

Stacked Area Chart

It would be nice to have a "Stacked Area Chart" option where each area is plotted not over the previous category, but stacked above it. This kind of chart can be useful to show how a breakdown of some category variable changes in time.

1639060008300.png

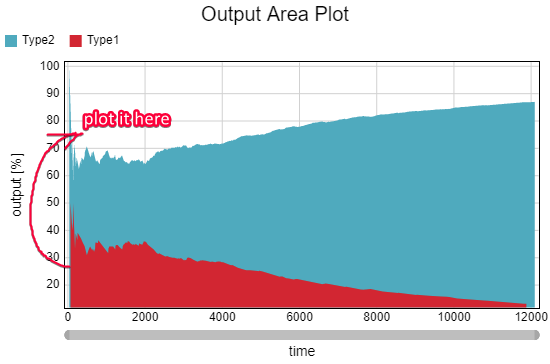
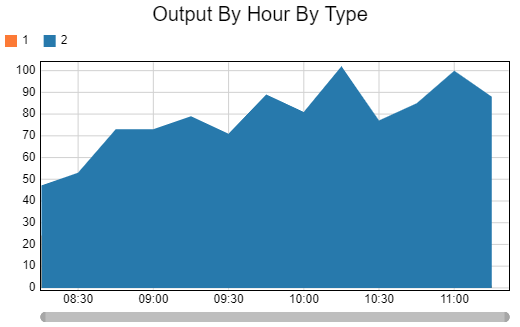
The same feature can also improve usability of Output by Hour by Type and other similar chart templates. At the moment, depending on the order of variables, some area plots may be hidden (orange area is behind the blue one):

1639060085900.png

chartsfeature request
1639060008300.png (26.2 KiB)
1639060085900.png (17.3 KiB)
5 |100000

Up to 12 attachments (including images) can be used with a maximum of 23.8 MiB each and 47.7 MiB total.

No Comments

·

Write a Comment

Up to 12 attachments (including images) can be used with a maximum of 23.8 MiB each and 47.7 MiB total.

Your Opinion Counts

Share your great idea, or help out by voting for other people's ideas.