Idea

Serge A avatar image
3 Likes"
Serge A suggested Jordan Johnson commented

Support other tabular data sources in generic FlexSim charts

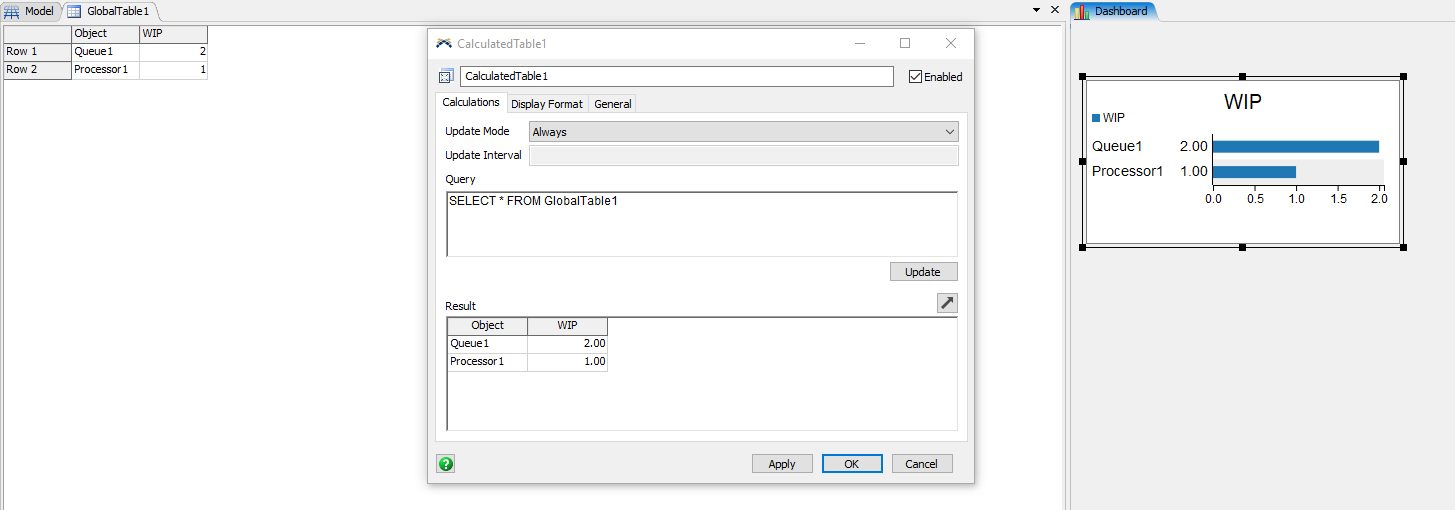
Generic FlexSim charts accept only one type of data sources: StatisticsCollectors.

It's really a pain when there are other tables in the model which happen to be something other than statistics collectors (for historical or implementation reasons). That data cannot be visualized in FlexSim.

Currently the workaround is to export these tables, and use 3rd party visualization tools (Excel, R, whatever). Another workaround is to copy >variables/data of the global table into >stats/data of a dummy statistics collector, and refresh the relevant view if necessary.

Could you please support GlobalTables or other table/bundle nodes as chart data sources? I suppose that static tables might not have the same events and provide the same level of integration as live statistics collectors, but "live" functionality could be gracefully degraded (updating on model stop only, or periodically, or manually). Having a chart updated manually is better than having no chart.

chartsfeature request
9u9cn.png (8.5 KiB)
5 |100000

Up to 12 attachments (including images) can be used with a maximum of 23.8 MiB each and 47.7 MiB total.

1 Comment

·
Phil BoBo avatar image
5 Likes"
Phil BoBo commented

You can point a chart at a StatisticsCollector or a CalculatedTable.

If you want to put arbitrary data into a chart without a StatisticsCollector, you could just use a CalculatedTable:

SELECT * FROM GlobalTable1

· 2
5 |100000

Up to 12 attachments (including images) can be used with a maximum of 23.8 MiB each and 47.7 MiB total.

Serge A avatar image Serge A commented ·

Thank you. This solves the problem for Global Tables. Is there a similar solution for arbitrary table nodes?

0 Likes 0 ·
Jordan Johnson avatar image Jordan Johnson ♦♦ Serge A commented ·

The charts are designed to work with any bundle. The UI does not currently support choosing data other than a Statistics Collector or Calculated Table, but you can set the bundle manually by setting the correct node in the chart's variables. Here is a model that does that.

charthack.fsm

There is an issue on the dev list to make this easier.

0 Likes 0 ·
charthack.fsm (22.8 KiB)

Write a Comment

Up to 12 attachments (including images) can be used with a maximum of 23.8 MiB each and 47.7 MiB total.

Your Opinion Counts

Share your great idea, or help out by voting for other people's ideas.