question

a_ltf avatar image
0 Likes"
a_ltf asked Jason Lightfoot commented

poisson distribution

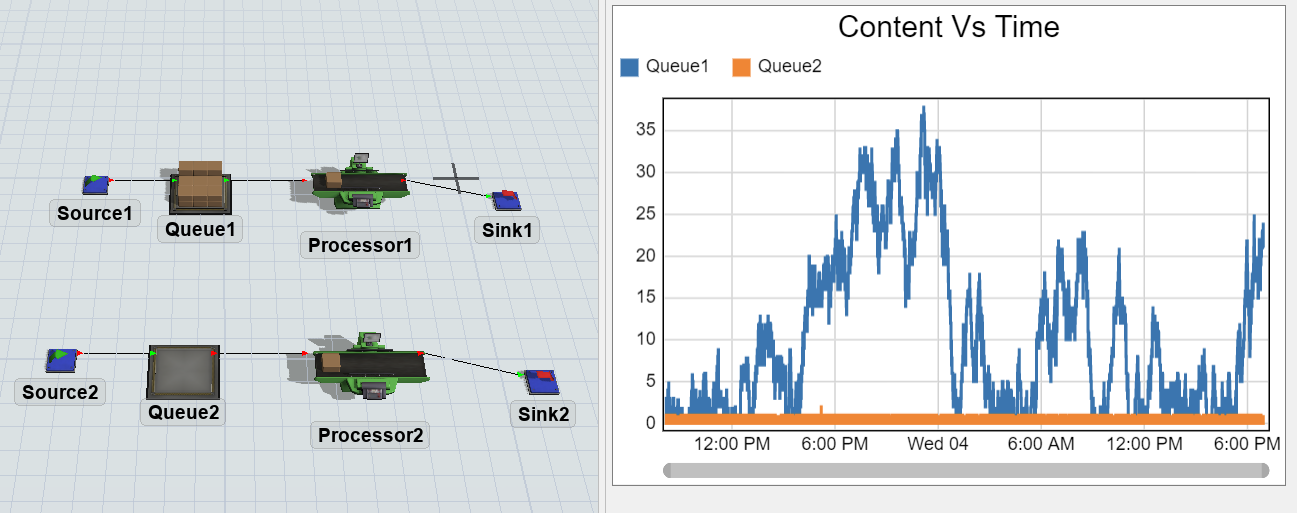
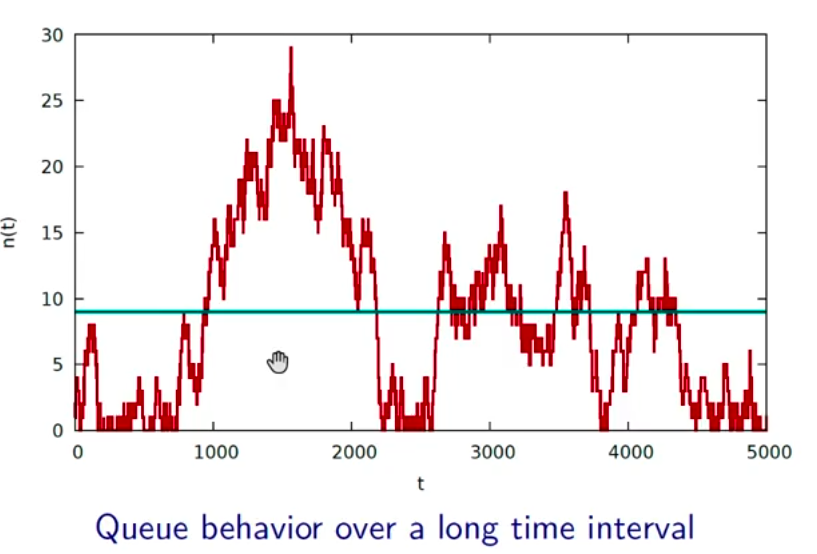
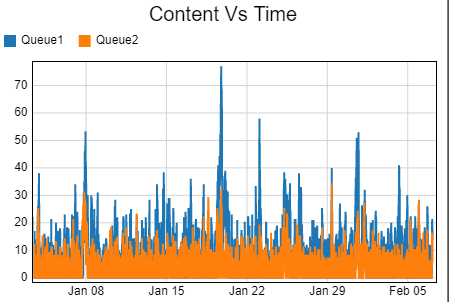
in a simple M/M/1 system with identical parameters of poisson arrival time and processing time but different units, getting different results for the average content in the queue

1) arrival time = 1 min, processing time =0.9 minute

2) arrival time = 60 sec, processing time = 54 sec

1672778304620.png

FlexSim 22.2.1
poisson distribution
1672778304620.png (100.8 KiB)
· 2
5 |100000

Up to 12 attachments (including images) can be used with a maximum of 23.8 MiB each and 47.7 MiB total.

Jordan Johnson avatar image Jordan Johnson ♦♦ commented ·

Please post a model. This is difficult to investigate from just the screenshot and the description.

0 Likes 0 ·
a_ltf avatar image a_ltf commented ·

poisson.fsm

@Jordan Johnson

according to the exact formula the average parts in the queue is (54/60)/(1-(54/60)) = 9 parts

0 Likes 0 ·
poisson.fsm (30.2 KiB)

1 Answer

·
Jordan Johnson avatar image
3 Likes"
Jordan Johnson answered Jason Lightfoot commented

After looking at this model, I think FlexSim is performing the calculations as expected. The issue is misusing the Poisson distribution.

Here's what happens. Processor 1 uses poisson(0.9) to calculate how long items need to process. If you just sample the poisson(0.9) distribution 10 times, here is a set of answers you could get:

[0, 1, 3, 0, 1, 0, 0, 3, 0, 1]

FlexSim then converts these values from minutes into model units, so you get something like this:

[0, 60, 180, 0, 60, 0, 0, 180, 0, 60]

Processor 2, on the other hand, uses poisson(54). Sampling that distribution 10 times gives values like these:

[60, 47, 55, 51, 49, 50, 56, 63, 63, 62]

You can see that these values are very, very different from the first set of values. This is why the first processor takes so much longer than the second.

I say it's a misuse of the Poisson distribution because when you sample the Poisson distribution, you get a result of "how many events" not "how long between events".

However, if you use something like the Date Time Source, you can specify how many arrivals you would like each time period. That would be a very good place to use the Poisson distribution.

· 2
5 |100000

Up to 12 attachments (including images) can be used with a maximum of 23.8 MiB each and 47.7 MiB total.

a_ltf avatar image a_ltf commented ·

but still can't see why the second process doesn't behave as expected or near the formula.

1672785470779.png

-1 Like -1 ·
1672785470779.png (155.0 KiB)
Jason Lightfoot avatar image Jason Lightfoot ♦ a_ltf commented ·

The processing time difference isn't actually a big contributor to gap in the results. With the same arrival data the two queues have this content:

1672843240266.png

But you're also misusing the poisson as the interarrival time on the source objects - one being set to minutes and the other seconds.

If you think your arrivals are following a Poisson process then the interarrival times should be using negative exponential distribution - again not poisson.

2 Likes 2 ·
1672843240266.png (18.9 KiB)

Write an Answer

Hint: Notify or tag a user in this post by typing @username.

Up to 12 attachments (including images) can be used with a maximum of 23.8 MiB each and 47.7 MiB total.