question

justinrusty avatar image
0 Likes"
justinrusty asked Jason Lightfoot commented

How to print an Event Table to console?

I have a global list in my process that receives a number of tokens that contains labeled information from a global table about initial inventory. Through my process I have a pull from list that continuously pulls from this label as well as a system for replenishing when the inventory gets too low. I can pause my program at any time and see this table that is generated.

I created an Event that references this global list to pull certain values from it so I can periodically measure the inventory and make a graph of it throughout days or weeks at a time.

The issue is when I create this event and reference these values I get an error that states certain columns or rows do not exist when they should...

The error specifically is as follows:

"time: 1.000000 exception: FlexScript exception: Invalid row number: 1 in Table.query() result table. at MODEL:/Tools/UserEvents/CalcPallets>variables/event"

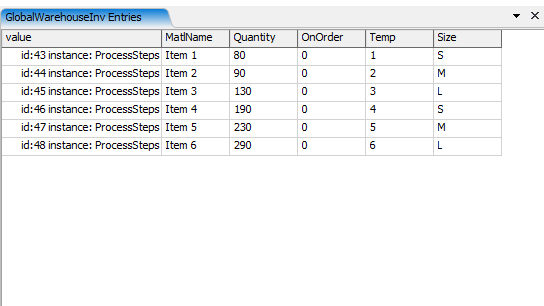
Below I have provided a screenshot of my Global list entrees

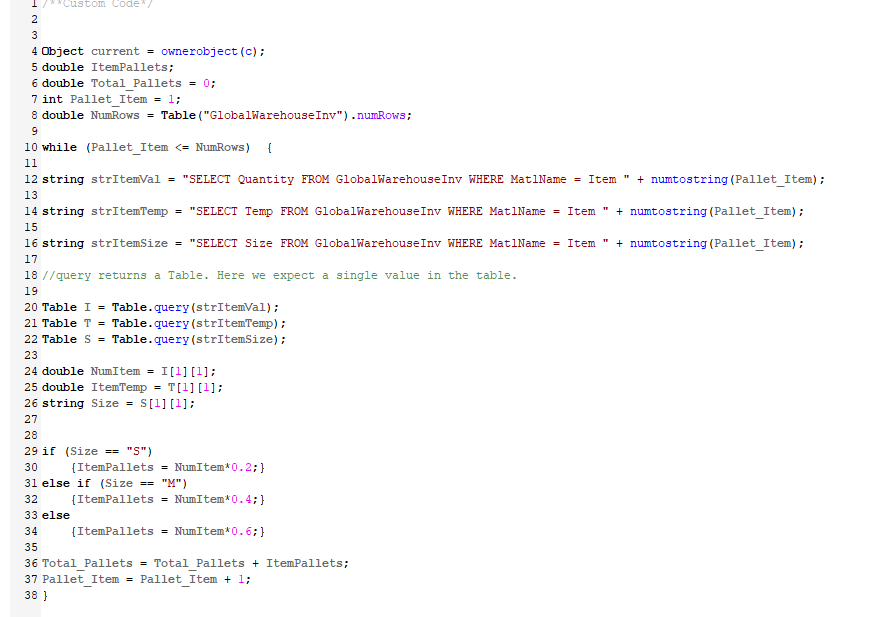
as well as the code provided in my event.

1673208076438.png1673208040724.png

If possible I would like advice on how to print my event table to console so I can see exactly what information it does have stored and why it doesn't recognize any rows.

But if anyone knows specifically what I am doing wrong either with my references or my table query that is even more appreciated.


FlexSim 22.2.4
querytablessystem consoleevents
1673208040724.png (53.0 KiB)
1673208076438.png (13.2 KiB)
· 1
5 |100000

Up to 12 attachments (including images) can be used with a maximum of 23.8 MiB each and 47.7 MiB total.

Joerg Vogel avatar image Joerg Vogel commented ·
@justinrusty, is there any reason why you haven’t added the hint of your previous questions answer?
0 Likes 0 ·

1 Answer

·
Jason Lightfoot avatar image
0 Likes"
Jason Lightfoot answered Jason Lightfoot commented

Here's a method using one sql statement (just these two lines are needed):

Table t=Table.query("SELECT SUM (Quantity* (CASE WHEN Size='S' THEN 0.2 WHEN Size='M' THEN 0.4  ELSE 0.6 END )) AS TotalPallets FROM GlobalWarehouseInv");
print (time(),"Total Pallets:", t[1][1]);

Here is your original code with corrected syntax which will print the same value to the output console:

double itemPallets;
double totalPallets;
int palletItem=1;
double numRows=List("GlobalWarehouseInv").entries().length;

while (palletItem<=numRows) {
    Table t=Table.query("SELECT Quantity, Temp, Size FROM GlobalWarehouseInv WHERE MatlName='Item "+palletItem+"'");
    double numItems=t[1][1];
    double temp=t[1][2];
    string size=t[1][3];
    
    if (size=="S")
        itemPallets=numItems*0.2;
    else if (size=="M")
        itemPallets=numItems*0.4;
    else
        itemPallets=numItems*0.6;
    
    totalPallets+=itemPallets;
    palletItem++;
}
print (time(),"Total Pallets:", totalPallets);

The first thing to note is using the list entries instead of table numRows.

The next is that the material name is enclosed in single apostrophes as it needs to evaluate as a string not a column name or variable.

Another is that you can get all three values for a record in one query.

In order to debug your code you can place breakpoints on one or more lines which will open the FlexScript debugger and allow you to inspect local variables and evaluate expressions using them. If that was the purpose of printing to a console then the debugger is going to be more powerful than print statements, although there are still some occasions where you can need both.


· 2
5 |100000

Up to 12 attachments (including images) can be used with a maximum of 23.8 MiB each and 47.7 MiB total.

justinrusty avatar image justinrusty commented ·
Using the Debugging tool the variables are updating the way i want them to. However my totalPallets Variable is a global variable that is attatched to my graph and for whatever reason it updates on the event but not on my dashboard graph
0 Likes 0 ·
Jason Lightfoot avatar image Jason Lightfoot ♦ justinrusty commented ·
If you're wanting to plot this I would use a stats collector and the top SQL expression to find the value of each interval. You could also group by size and show the seperate plots
1 Like 1 ·

Write an Answer

Hint: Notify or tag a user in this post by typing @username.

Up to 12 attachments (including images) can be used with a maximum of 23.8 MiB each and 47.7 MiB total.