question

Meng,Li avatar image
0 Likes"
Meng,Li asked Andrew O commented

Statistics collector problem

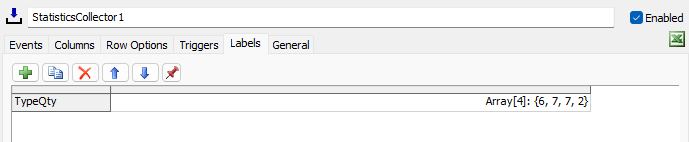
Here is a simple scenario as the model attached show. I got confused trying to collect respective quantity of different Type items in one line chart, and could't find a way.

I have read the Statistics Collector part in the manual, but still not very clear about specific settings.

Any help will be appreciate.

002.fsm


FlexSim 22.2.1
statistic collectorqueue contentcustomcode
002.fsm (43.5 KiB)
· 1
5 |100000

Up to 12 attachments (including images) can be used with a maximum of 23.8 MiB each and 47.7 MiB total.

Andrew O avatar image Andrew O commented ·

Hi @Meng,Li, was Felix Möhlmann's answer helpful? If so, please click the "Accept" button at the bottom of their answer. Or if you still have questions, add a comment and we'll continue the conversation.

If we haven't heard back from you within 3 business days we'll auto-accept an answer, but you can always unaccept and comment back to reopen your question.

0 Likes 0 ·

1 Answer

·
Felix Möhlmann avatar image
0 Likes"
Felix Möhlmann answered Felix Möhlmann edited

The closest default chart to what you are trying to create is probably the line chart variant of "WIP By Type" (which you could in fact use as your chart). You can inspect how it works by installing its components. That particular chart actually uses two statistics collectors. But that is mostly just because the "Core Collector" is setup to interact with a lot of different objects in FlexSim, so it gets reused for quite a lot of chart templates.

The important thing is: In order to effectively collect the content per type over time, you need to keep track of the current value (per type) somewhere outside of the actual data table. Since if that information is only available there, you would have to search for the last row that contains the current type whenever an item enters or leaves, in order to then increment/decrement that last value. So it is much more efficient to store that value somewhere else. (The "Content by Time" chart you seem to have looked at doesn't differentiate by type, so there you could always just look at the previous row)

The chart template of "WIP By Type" uses row labels for this. There the item's Type is used as the row value when creating a new row. In the "On Row Adding" trigger, a row label called "WIP" is created the first time a given type value appears. All rows are immediately finished. So the next time the same type value appears a new row will be created instead of updating the old (because you want to keep the old data when gathering data for a time plot). The row label on the other hand is unique per row value. So when the next item enters, the same label from the previous row with that row value will be accessed and updated to the new content level for that type.

You can build the same structure but use an array label on the collector itself to hold the content values. This might be easier to follow, since you can view those values directly in the GUI. I've added such an example to your model. Note that this method only really works well for ordered numerical type values.

1675683059972.png

002_fm.fsm


1675683059972.png (11.3 KiB)
002-fm.fsm (635.8 KiB)
5 |100000

Up to 12 attachments (including images) can be used with a maximum of 23.8 MiB each and 47.7 MiB total.

Write an Answer

Hint: Notify or tag a user in this post by typing @username.

Up to 12 attachments (including images) can be used with a maximum of 23.8 MiB each and 47.7 MiB total.