question

Claire Krupp avatar image
0 Likes"
Claire Krupp asked Claire Krupp commented

Average utilization of park points (Control Points)

I have a model using the AGV navigator with several parking locations. I am using the standard parking method with a few enhancements, and now I want to assess how often each parking location is in use.

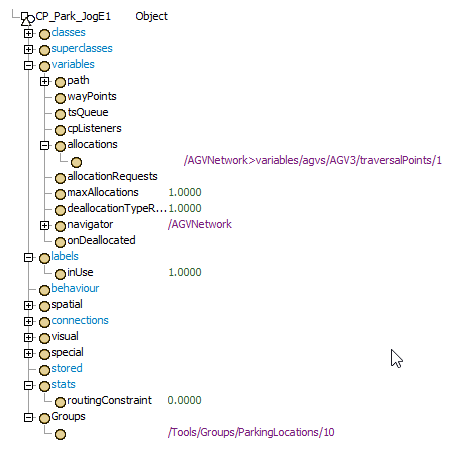
The Control Point object does not seem to have any statistics collected. This is in the user manual:

1682699033764.png

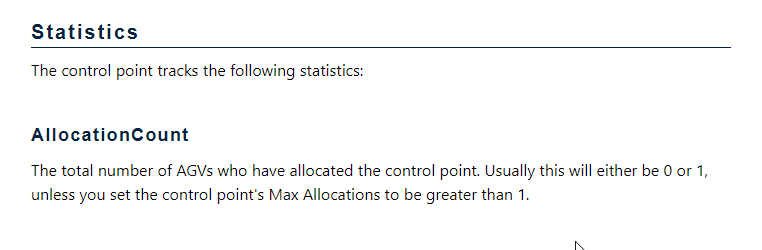
but this does not seem to be true anymore (please update the manual!). There is no statistics icon on the properties and AllocationCount does not appear in the tree or anywhere else in the manual.

I have already discovered that you can't use subnodes.length to find out how many AGVs are at the location, but from another question on this site I found out how to use

  1. Model.find(value.name + ">variables/allocations").subnodes.length

to tell me how many AGVs are allocated to the control point (value here is the control point in the list of parkPoints).

But this only gives the "contents" at that moment in time, and if I put it in a Statistics Collector I only get a chart showing what is there at that moment.

I tried installing the standard chart for Average Contents, but that uses getstat:

  1. getstat(data.rowValue, "Content", STAT_AVERAGE, instance)

and this doesn't work for control points.


So how do I find out the average allocations through time, and what's the best way to chart it?

Do I need to create a table of tracked variables?

Thanks.


Also, please add this and the AllocationCount stat to your wishlist!


FlexSim 23.1.1
statisticscontrol pointallocations
1682699033764.png (12.1 KiB)
· 1
5 |100000

Up to 12 attachments (including images) can be used with a maximum of 23.8 MiB each and 47.7 MiB total.

1 Answer

Jordan Johnson avatar image
1 Like"
Jordan Johnson answered Claire Krupp commented

Here is an example model that gets the Allocation Count statistic:

AllocationCountStatDemo.fsm

The most common stats are available through the stats property on the Object class:
https://docs.flexsim.com/en/23.1/Reference/CodingInFlexSim/FlexScriptAPIReference/Tree/Object.html#Property-stats

For any other stats, including AllocationCount, you have to use the getstat() command:

https://docs.flexsim.com/en/21.1/Reference/CodingInFlexSim/CommandReference/Commands.html#getstat

All that being said, our documentation doesn't help users draw the connection between the "Statistics" section for objects and using the getstat() command. I'll add an issue to the dev list to see if we can improve that somehow.

However, I don't think the allocation count statistic is what you really want. AGVs allocate from control point to control point as they travel. If the parking spot point is far away from the previous control point, all that time travelling to the point will count as "Utilized". In addition, an AGV can allocate the parking spot but not stop there. For example, an AGV might be on it's way to a parking spot, but then be redirected to another destination. In that case, it would pass over the parking spot without using it.

Here is an example model. It has the AGV Heuristic Parking flow. There are two stats collectors: one to show the utilization for each parking point and one to show a Gantt chart for each parking point. The both work by using events on reset or when the parking zone is entered/exited. It was quite a few steps to make, but shouldn't be too bad with an example:

AGVParkPointUtilDemo.fsm

I will add your request for an easier version of these charts to the dev list.


· 3
5 |100000

Up to 12 attachments (including images) can be used with a maximum of 23.8 MiB each and 47.7 MiB total.