I want to display the mode staytime of processor.(Note: "Mode" means the staytime which appear
Maximum frequency).
How to develop the node ? or what command I can use? thanks for your answer!
I want to display the mode staytime of processor.(Note: "Mode" means the staytime which appear
Maximum frequency).
How to develop the node ? or what command I can use? thanks for your answer!
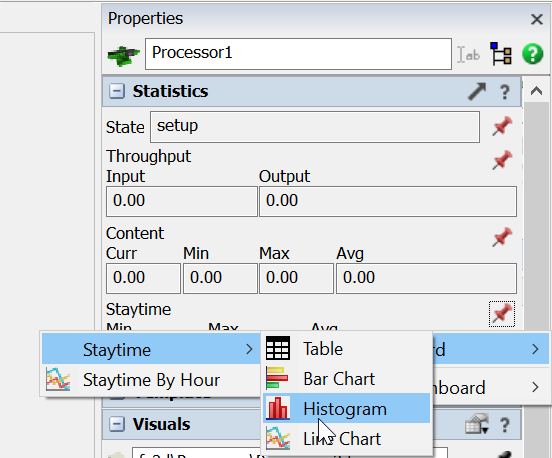
It should be a statistic red pin drop out of statistics property.
 Typically it is a difference of model runtime between item is exiting and entering an object. You can compute it easily in triggers of objects or by event driven activities in process flow. Therefore you store the entry time in a label of item or token and build the difference to an exit event or trigger. To show staytime values you set them in a tracked variable.
13 People are following this question.
FlexSim can help you understand and improve any system or process. Transform your existing data into accurate predictions.
FlexSim is a fully 3D simulation software environment. FlexSim can be used to simulate any process in any industry.
FlexSim®, FlexSim Healthcare™, Problem Solved.®, the FlexSim logo, the FlexSim X-mark, and the FlexSim Healthcare logo with stylized Caduceus mark are trademarks of FlexSim Software Products, Inc. All rights reserved.
