Hi all.
I wanted to combine both of this chart into one graph. It'll need to show current and new travel distance into one graph.
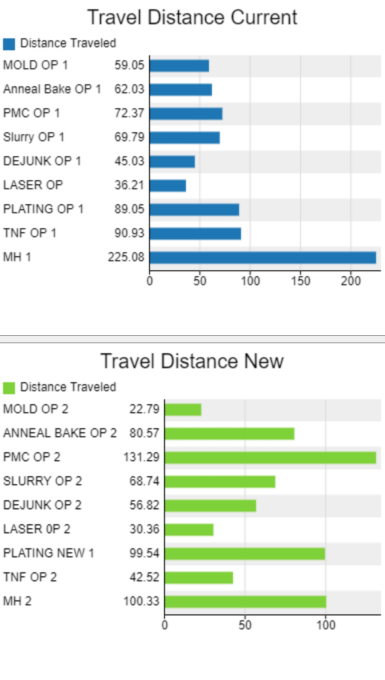
Hi all.
I wanted to combine both of this chart into one graph. It'll need to show current and new travel distance into one graph.
Couldn't you just add all operators to a single chart and sort the rows by the name? (After formalizing the naming scheme. Currently it seems like sometimes the number 2 indicates a "new" operator and at other times its the suffix "NEW").
With a little bit of extra work you can also use different colors for both types. For this, install the Statistics Collector behind the chart and add a new column that distinguishes the operators between old and new (in the attached model I do this through a label I assigned to the operators). Then set the chart to color the bars according to that column.
15 People are following this question.
FlexSim can help you understand and improve any system or process. Transform your existing data into accurate predictions.
FlexSim is a fully 3D simulation software environment. FlexSim can be used to simulate any process in any industry.
FlexSim®, FlexSim Healthcare™, Problem Solved.®, the FlexSim logo, the FlexSim X-mark, and the FlexSim Healthcare logo with stylized Caduceus mark are trademarks of FlexSim Software Products, Inc. All rights reserved.
May we collect and use your data?
Learn more about the Third Party Services we use and our Privacy Statement.May we collect and use your data to tailor your experience?
Explore the benefits of a customized experience by managing your privacy settings for this site or visit our Privacy Statement to learn more about your options.