question

Leandro Meirelles avatar image
0 Likes"
Leandro Meirelles asked Felix Möhlmann commented

AGV battery system emulation doubts

Hello,

I emulated a AGV battery system with kinetic tracked variable and It's working, but I have 3 questions:

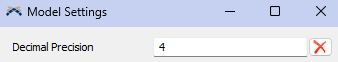
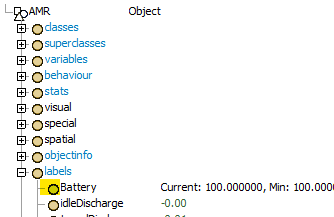
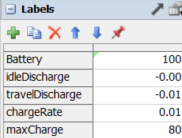
1) I rely on labels to provide the rate that my battery level will charge or discharge, but for example, in travelDischarge label, i need to place the value -0.0077, but Flexsim rounds to -0.01. How can I keep the proper value?

1718050582968.png

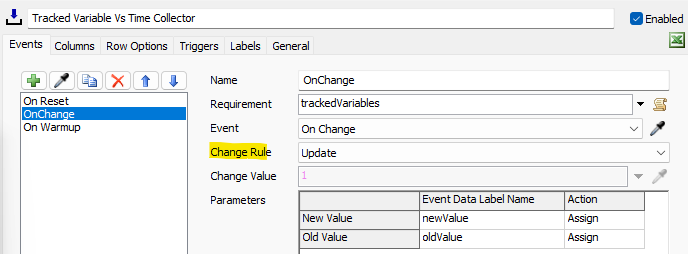
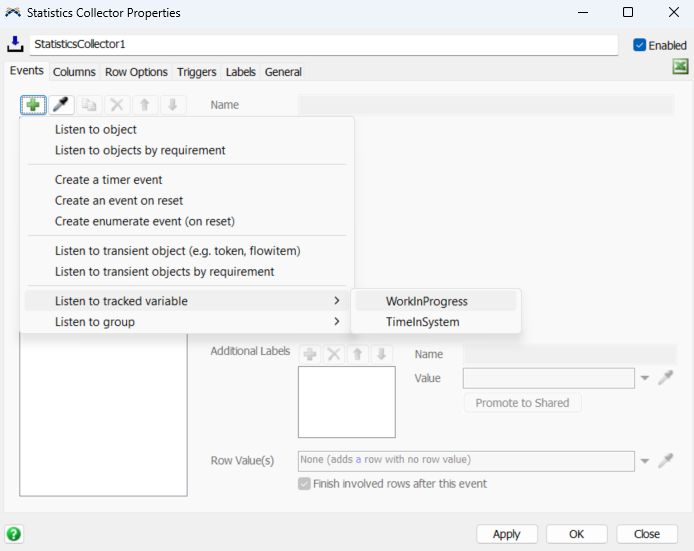
2) Now I watch the battery level through the tracked label, how can I show some statistics on dashboard? For example the battery value by time.


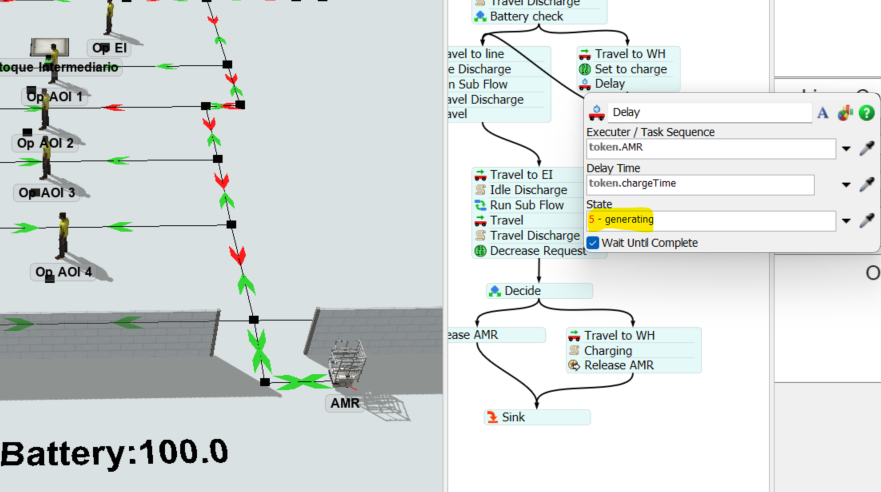
3) I am using the delay block to keep the AMR charging, but I can't find the "charging" state, is It possible to set a state that is not on the list by codding?

1718050551806.png


Follow my model attached, thanks alot!

problem1.fsm

FlexSim 24.1.0
agv battery system
1718050551806.png (168.8 KiB)
1718050582968.png (16.7 KiB)
problem1.fsm (19.8 MiB)
· 1
5 |100000

Up to 12 attachments (including images) can be used with a maximum of 23.8 MiB each and 47.7 MiB total.

Joerg Vogel avatar image Joerg Vogel commented ·
In model settings you can change decimal precision shown in edit fields. Even if you see rounded values in edit fields, FlexSim uses more digits of a floating numbered value.

Build in Battery Level is a feature of AGV Library objects.

0 Likes 0 ·
Felix Möhlmann avatar image
0 Likes"
Felix Möhlmann answered

1) The rounding is only visual. You can change how many decimals are shown in the model settings.

capture1.png

2) Add a tracked variable line chart from the dashboard library and sample the TR label of the AMR. Then install the chart components to access the Statistics Collector and set the "Change Rule" of the OnChange event to "Update".

capture2.png

3) You can set the state to any number. States up to that number will automatically be added to the object's state profile. The first 50 states have default names, further states will just be called "51", "52" and so on. The name that is displayed in a state chart is the one assigned to the state number in the linked State Table. So you could use one of the default states and change the display name in the State Table.


capture1.png (3.3 KiB)
capture2.png (22.2 KiB)
5 |100000

Up to 12 attachments (including images) can be used with a maximum of 23.8 MiB each and 47.7 MiB total.

Leandro Meirelles avatar image
0 Likes"
Leandro Meirelles answered Felix Möhlmann commented

Hi Felix, about items 1 and 3 its all clear, but item 2 I can't find the tracked variable to add the event as you did on Statistics collector. I also added the tracked variable line chart from the dashboard library and could not sample the TR label of the AMR.

1718132979139.png


1718132979139.png (82.5 KiB)
· 1
5 |100000

Up to 12 attachments (including images) can be used with a maximum of 23.8 MiB each and 47.7 MiB total.

Felix Möhlmann avatar image Felix Möhlmann commented ·

You can sample the TR label node from the tree view.

capture1.png

0 Likes 0 ·
capture1.png (8.0 KiB)

Write an Answer

Hint: Notify or tag a user in this post by typing @username.

Up to 12 attachments (including images) can be used with a maximum of 23.8 MiB each and 47.7 MiB total.