question

Patrick Cloutier avatar image
0 Likes"
Patrick Cloutier asked Patrick Cloutier commented

How to record State Analysis Statistics every hour instead of globally

Hello,

I have a system that runs 24 hrs/day for 47 straight days with a lift truck doing stuff.

The end result I need is a table with the hourly utilization of that lift truck for every hour of the day. So I will have a table of 24 lines (one for each hour) and 8 columns (one for each state). Each hourly stat will be the average of 47 days.

Here's what I'm thinking:

  1. Create a global table with 8 columns and 24 x 47 = 1128 lines
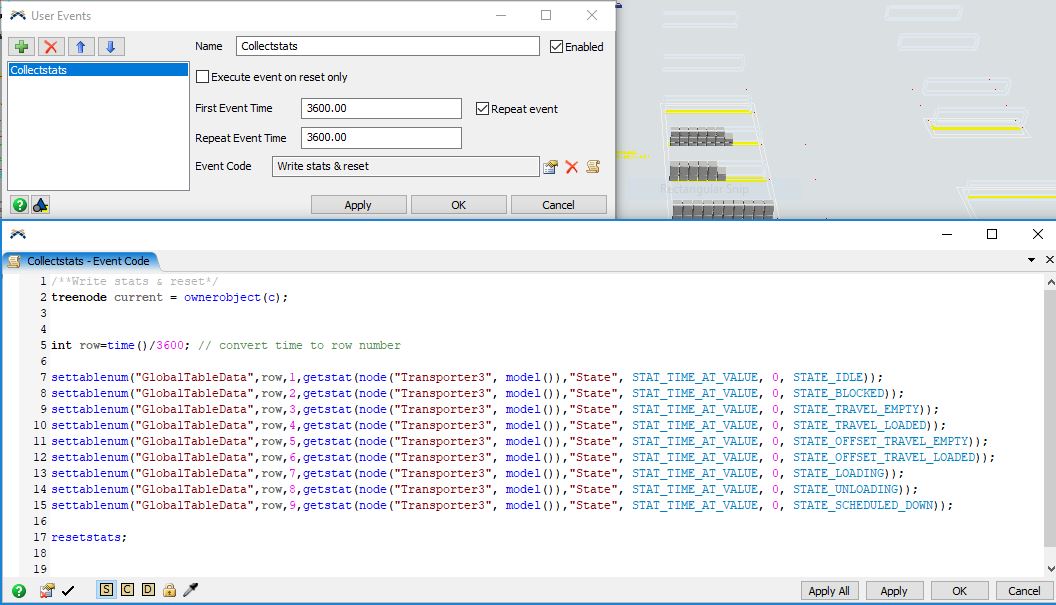
  2. User event that repeats every hour which writes the collected state stats into the corresponding table line using getstat
  3. The user event then resetstats
  4. When the 47-day simulation run is done I export that table to Excel and calculate the averages I need.

Any simpler way that you can think of?

I'm afraid this will slow my simulation considerably.

Thanks a lot,

FlexSim 16.2.2
stats
· 2
5 |100000

Up to 12 attachments (including images) can be used with a maximum of 23.8 MiB each and 47.7 MiB total.

Kari Payton avatar image Kari Payton commented ·

@Patrick Cloutier have you tried making a GANTT chart?

0 Likes 0 ·
Patrick Cloutier avatar image Patrick Cloutier Kari Payton commented ·

Yes but I really need the hourly utilization and that didn't work with the Gantt,

0 Likes 0 ·

1 Answer

·
Patrick Cloutier avatar image
0 Likes"
Patrick Cloutier answered Patrick Cloutier commented

Case closed. I did what I had in mind and it works perfectly and doesn't slow down the simulation.

· 2
5 |100000

Up to 12 attachments (including images) can be used with a maximum of 23.8 MiB each and 47.7 MiB total.

Karen Measells avatar image Karen Measells commented ·

Is this code something you can share? Or has this functionality been added to the healthcare module?

Thanks-

Karen

0 Likes 0 ·
Patrick Cloutier avatar image Patrick Cloutier Karen Measells commented ·

I don't know if it's been added but I doubt it because it's a pretty custom stat.

Here is the code in the attached screenshot. Nothing spectacular. Just writes the states to the table every hour and then resets the stats so that I always get the stats for the last hour. The table has 9 colums for the 9 states and as many rows as needed for my simulation run. I then export the table to Excel (copy-paste) to calc percentages.

0 Likes 0 ·

Write an Answer

Hint: Notify or tag a user in this post by typing @username.

Up to 12 attachments (including images) can be used with a maximum of 23.8 MiB each and 47.7 MiB total.