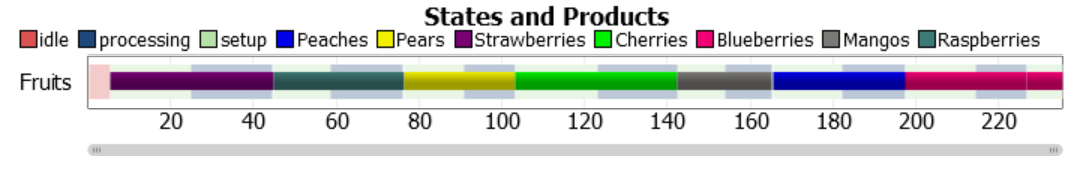
The State Gantt chart allows you to chart an object's states, but what if you want to overlay the product type the object is currently processing on top of those states? Can this be achieved with the Custom Gantt Chart?
The regular State Gantt Chart adds listeners to the objects that it's collecting stats on in order to know when the state changes. The Custom Gantt chart doesn't give you the ability to add listeners, and even if it did, the State Gantt Chart is doing a bunch of stuff behind the scenes to ensure the data is collected correctly. So in order to do this, we're going to use a State Gantt Chart and a Global Table.
I've attached a very simple model that overlays a processor's product type on top of its states.
The first step was to create a State Gantt Chart that is linked to the processor. Then in the Custom Gantt Chart, we create two associations:
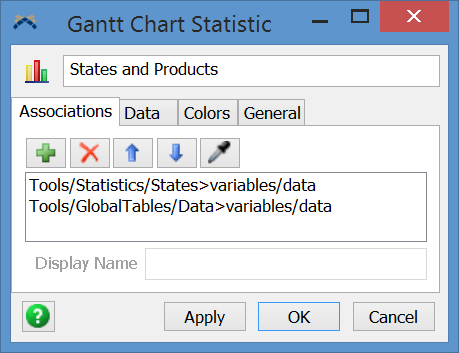
The first is to the State Gantt Chart's data node. This is a node with bundle data on it. The second association is to a Global Table (where we have check the box Use Bundle for ease of getting the data out).
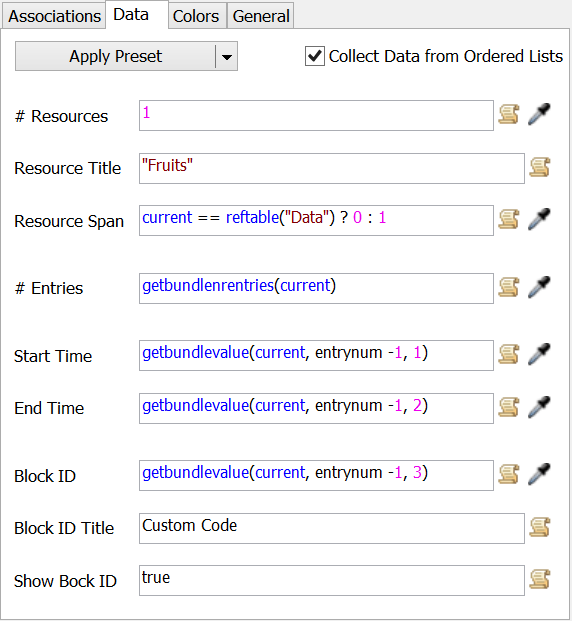
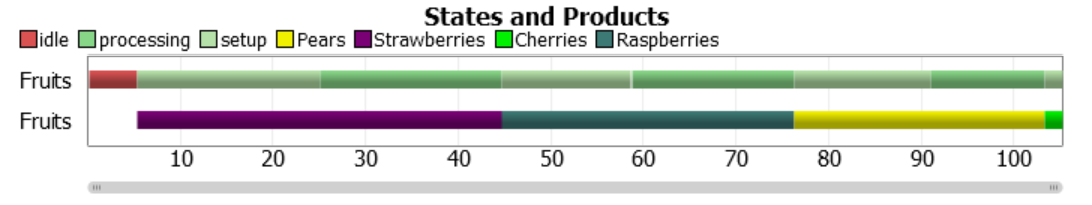
On the Data tab, I first applied the Bundle Values preset to give me a starting point. The # Resources will be fired for each Association, so that stays as 1. The Resource Span allows us to overlay the 2nd Resource on top of the first Resource. If you change the Resource Span field to 0 the two sets of data will be on their own lines rather than overlapping.
The # Entries, Start Time, End Time and Block ID remain as the default preset values, except I incremented the column index by 1. This is due to the way the state gantt chart was storing its data. (Note the Dummy column in the global table to offset the table data so the code works for both associations). The fields read data from either the Data global table or the state gantt chart's data node.
The processor has code in its OnEntry trigger to add a row to the global table each time an item enters the processor. The End Time column is initially set to -1. This tells the Gantt Chart to draw the bar from its starting time to the left edge of the chart, allowing you to see the data continuously as the model runs. The OnExit trigger of the processor updates the End Time to the exit time.
Back in the Custom Gantt Chart properties window, you'll notice there is some Custom Code for the Block ID. The Block ID must be a unique number. For a processor, states 1-21 are being utilized, so our Block IDs for our types need to be greater than 21. That's why you'll notice that the values in the Type column of our global table are the numbers 22-31. This requires that I subtract 21 from the Block ID when I need to read the Block ID Title from the ProductTypes global table in order to read the correct row number. The states are read in by reading the state gantt chart's legend data.
- if (blockid > 21)
- return gettablestr("ProductTypes", blockid - 21, 1);
- treenode entryLegend = node("../entrylegend", current);
- return getbundlevalue(entryLegend, blockid - 1, 0);
I also added a OnModelReset trigger that clears the extra lines in the Data table.
2 People are following this question.
