I am on the learning curve for 17 from ver 3, and having difficulty recreating the data that I used to create by writing to the tasklist via a trigger at each processor. I could then look at any flex-bin item running through the model and see each of the stay-times by processor in the list. It feels like this should be easy to do or even automatic now but I can't find how?
If you want to log the stay time of each flow item at each processor, you can use the Exit trigger on the processor to write to a Global Table.
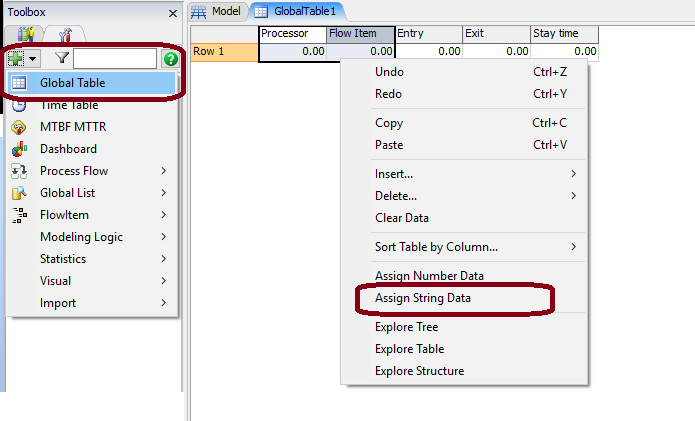
From the Tools panel, add a Global Table and give it the columns you want (you can right-click a column and select Assign String Data to make it a text column).
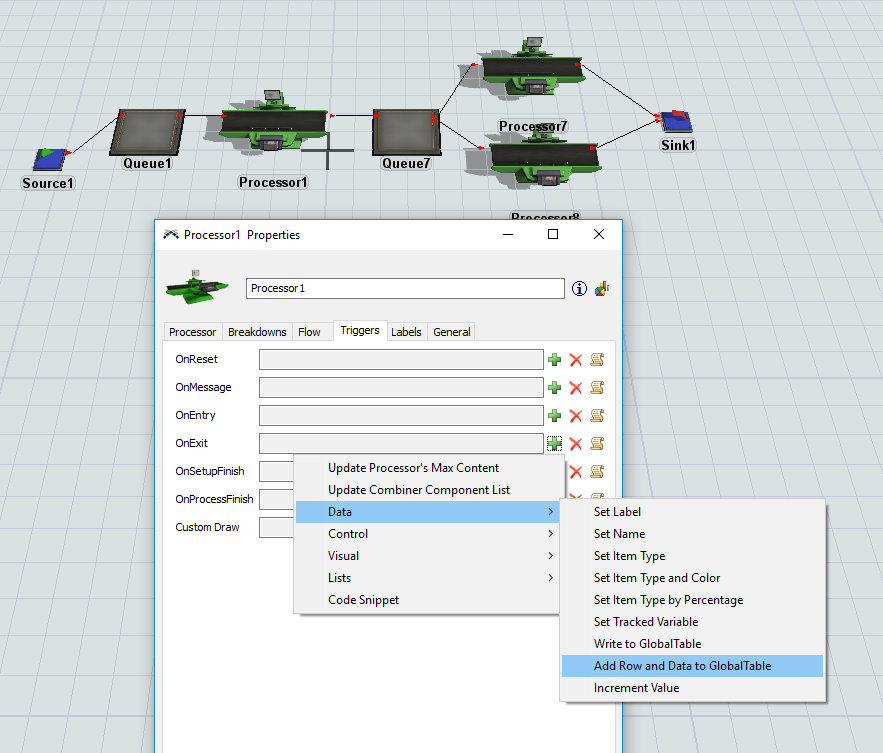
Then, on each processor you want to perform the logging on, add an On Exit trigger and select the Add Row And Data To Global Table option from the Data submenu.
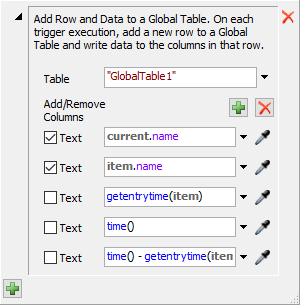
In the popup, enter the fields you want to add to the table, and run the model. You may want to add a reset trigger to reset the table (settablesize("MyGlobalTable", 1, gettablecols("MyGlobalTable")).
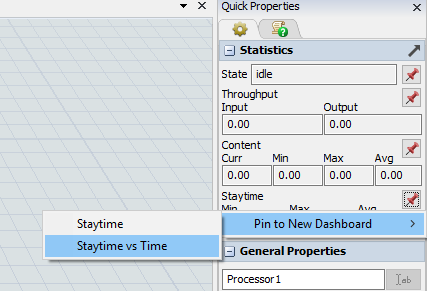
If you want to see the data visually, instead of in table form, you can also add the Staytime vs Time chart to a new dashboard, using the pin in the Quick Properties:
You can show all the results in a single graph by double clicking the chart and adding all processors you want to track in the Objects tab.
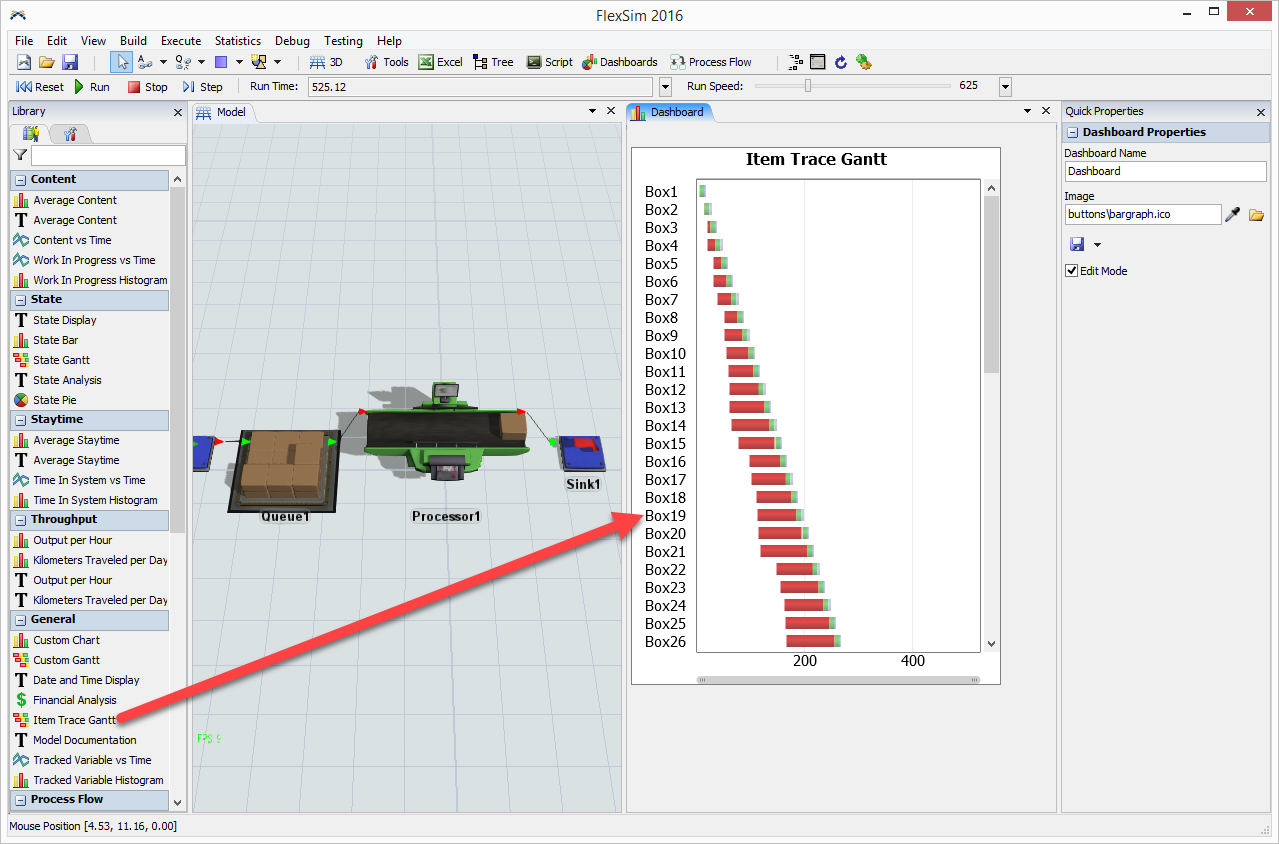
Finally, if you want to trace actual items, consider the Item Trace Gantt chart from the dashboard library, which will automatically add a Gantt trace for each item passing through a specific object (like the first queue).
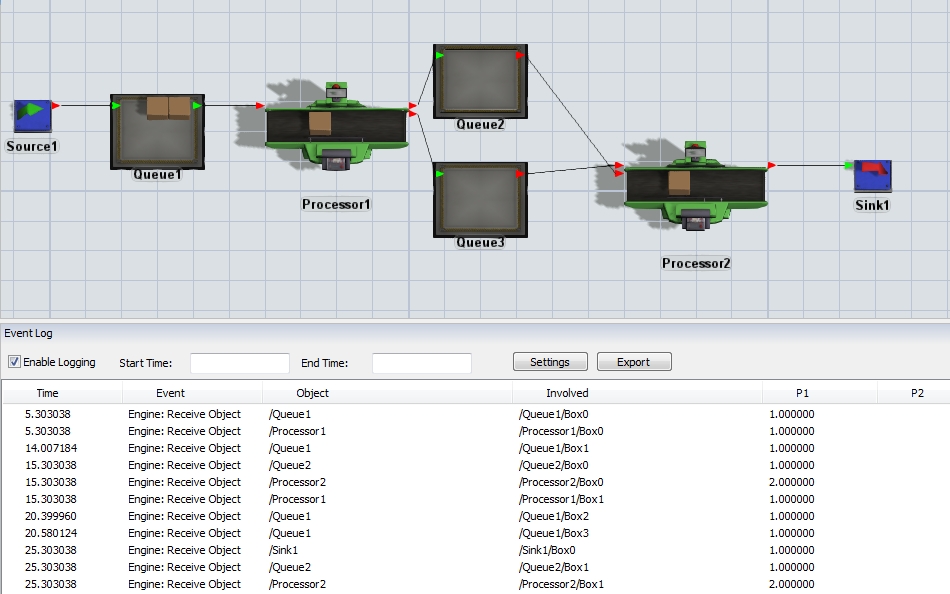
Maybe you are looking for the Event Log. You find this console in the Main Menu bar Debug > Event Log. Unfortunately the Flowitems get only the standard name. If you want to follow the item in your model, you should add a different suffix for example a number as a string to the name.
The Button Settings let you enter a menu wherein you can set the Events you like to see in the console.
@Jörg Vogel Jörg The event log has proven to be useful as I troubleshoot my model, Thank you again.
Thank you all for the responses, all are helpful and assist getting me to my end goal.
@Mischa Spelt Mischa the global table is great, I do have one issue as the table resets itself randomly during the simulation run, and erases prior data. I am trying to troubleshoot what is happening by stepping through.
@phil.bobo Phil the Item Trace Gantt is also helpful and a great visual for checking my recipes for ac
20jan-1.fsm6 People are following this question.
