question

pc neo avatar image
1 Like"
pc neo asked Phil BoBo answered

GUI - line chart does not draw multiple dataseries

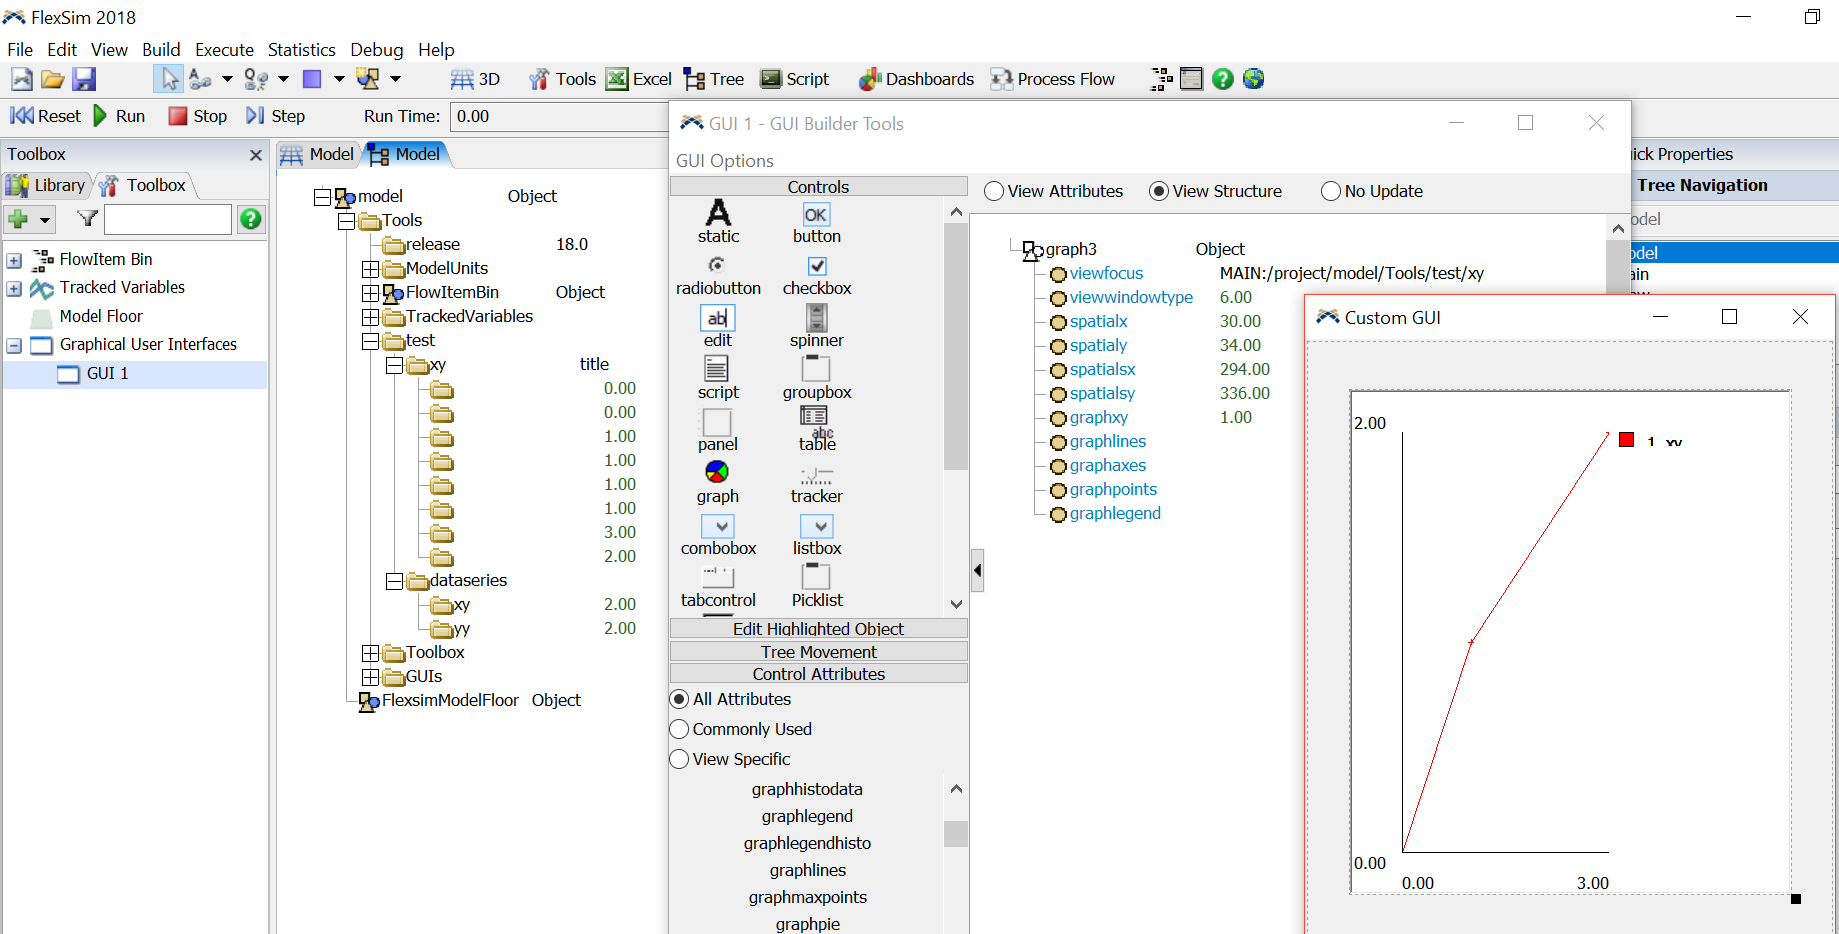
graph-dataseries.pnggraph-test.fsmFollowing the instructions in user manual, I am not able to draw line chart with multiple data series. Appreciated, if there is a pointer on how to have the chart draw rightly.

The model is attached. The result is attached as a pic herein.

FlexSim 18.0.2
gui
graph-dataseries.png (152.8 KiB)
graph-test.fsm (30.1 KiB)
5 |100000

Up to 12 attachments (including images) can be used with a maximum of 23.8 MiB each and 47.7 MiB total.

1 Answer

·
Phil BoBo avatar image
2 Likes"
Phil BoBo answered

You are trying to use a really old way of charting. The chart views and attributes you are trying to use in the GUI Builder with documentation from the View Attributes Reference are preserved for backwards compatibility. You shouldn't use these methods to create new charts.

You should use the Dashboard to draw charts. You can draw line graphs with multiple data series using Dashboard charts.

5 |100000

Up to 12 attachments (including images) can be used with a maximum of 23.8 MiB each and 47.7 MiB total.

Write an Answer

Hint: Notify or tag a user in this post by typing @username.

Up to 12 attachments (including images) can be used with a maximum of 23.8 MiB each and 47.7 MiB total.