Hello Everyone,
Actually I`m trying to visualization the data from dynamic create table in a Bar chart. I read that I need to use a StatisticsCollector to visualization the data in chart, but I need to fill a StatisticsCollector from scripts. I was trying to add new columns by copy the sample column in StatisticsCollector>variables/columns by command "createcopy()". And It works. I see new columns in statisticscollectors tree, but when I modify "valueNode" in StatisticsCollector>variables/columns/NewColumn, FlexSim program doesnt react on my changed. I searched information about it and found that column in statisticsCollectior is SimpleDataType, and I must use setsdtvalue. I tried it but effect is the same.
Do you have any suggestion how can I resolve this problem?
StatisticsCollectors - Dynamic adding columns
FlexSim 18.0.3
The big issue that I see with what you want to do is that the Statistics Collector is not designed to work if configured during a model run. It needs a reset, and calling OnReset for just the Statistics Collector only does half of what happens when you reset the whole model.
To use the Statistics Collector, you will need to flatten your data as much as possible. Right now, you have many tables. See if you can combine those tables into a single table (or at least a fixed number of tables), by adding a column that specifies the table name:
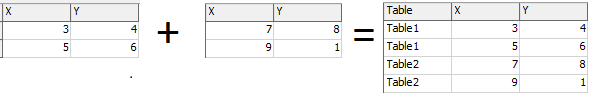
Once you do this, you will probably be able to find a way to put the data in a Statistics Collector. Often, it is convenient to use Process Flow to listen to when values change, and set up the Statistics Collector to listen to appropriate activities in that flow.
You can then use a Calculated Table to change the data you view during a model run by just running a new query on the correct table.
To change which options are selected on a chart, you will need to make sure those changes are applied. You can do that by setting the initailized variable on the chart to 0. On the next paint, the settings will be re-applied.
9 People are following this question.
