I can't seem to get any graph showing with the Throughput per hour or Composite Throughput per hour templates. The graph axis change with time but there is no graph showing.
See attached model.problem-with-throughput-template.fsm
I can't seem to get any graph showing with the Throughput per hour or Composite Throughput per hour templates. The graph axis change with time but there is no graph showing.
See attached model.problem-with-throughput-template.fsm
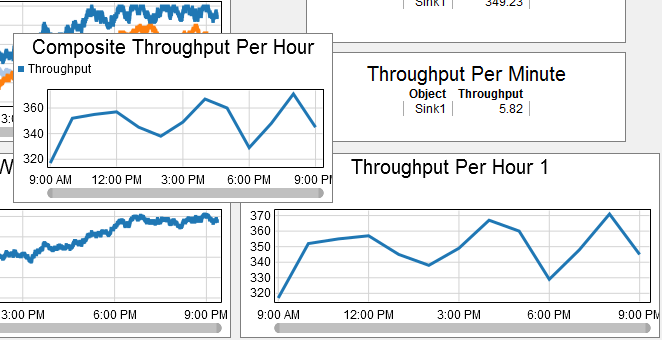
The time plots, unlike the table and bar charts, show the throughput at each hour, rather than total throughput / total hours. If you run the model for several hours, you can see the hour-by-hour trend in throughput:
8 People are following this question.
FlexSim can help you understand and improve any system or process. Transform your existing data into accurate predictions.
FlexSim is a fully 3D simulation software environment. FlexSim can be used to simulate any process in any industry.
FlexSim®, FlexSim Healthcare™, Problem Solved.®, the FlexSim logo, the FlexSim X-mark, and the FlexSim Healthcare logo with stylized Caduceus mark are trademarks of FlexSim Software Products, Inc. All rights reserved.
